
ADXMultiframeIndicator
Indicador
1 compras
Versão 1.0, Oct 2025
Windows, Mac
5.0
Avaliações: 2
Descrição
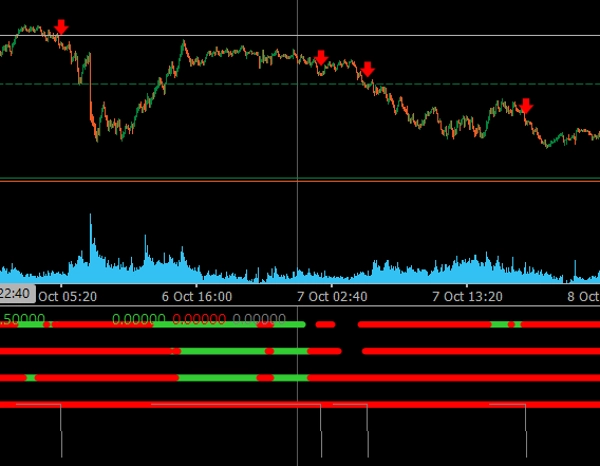
O Multi-Timeframe ADX Trend Dots & Arrows é um indicador de negociação profissional para cTrader, projetado para identificar tendências de mercado alinhadas em múltiplos períodos de tempo usando o Average Directional Movement Index (ADX).
🔹 Principais Características:
- ✅ Analise até 4 períodos de tempo personalizáveis (M15, H1, H4, Diário).
- ✅ Pontos coloridos mostram a tendência direcional (Verde = Tendência de alta, Vermelho = Tendência de baixa).
- ✅ Setas automáticas aparecem quando todos os períodos de tempo estão alinhados na mesma direção.
- ✅ Filtro de barras consecutivas reduz sinais falsos ou prematuros.
- ✅ Visualização limpa e moderna otimizada para temas de gráfico escuros e claros.
- ✅ Perfeito para identificar confirmações em múltiplos períodos de tempo e pontos de continuação de tendência.
Este indicador é ideal para traders que desejam ver o panorama geral e entrar apenas quando todos os períodos de tempo concordarem, proporcionando setups de negociação mais fortes e confiáveis.
Resumo
Resumo de IA
The ADXMultiframeIndicator is a trading indicator for the cTrader platform that identifies market trends by analyzing the Average Directional Movement Index (ADX) across multiple timeframes. It supports up to four customizable timeframes, including M15, H1, H4, and Daily. The indicator displays colored dots to indicate directional bias—green for uptrends and red for downtrends—and automatically shows arrows when all selected timeframes align in the same direction. A consecutive bars filter is included to reduce false or premature signals. The visualization is designed to be clear and modern, compatible with both dark and light chart themes. This tool assists traders in confirming multi-timeframe trends and identifying trend continuation points by highlighting when all timeframes agree, facilitating more informed trade entries. It is particularly useful for analyzing indices markets.
Perfil do indicador
Avaliações de clientes
5.0
Avaliações: 2
5 | 100 % | |
4 | 0 % | |
3 | 0 % | |
2 | 0 % | |
1 | 0 % |
Avaliações de clientes
October 28, 2025
the first signal should not decide the only input, but it can look better than it is during a lucky run.
Conversa
Perguntas frequentes
Indices
Os produtos disponíveis através da cTrader Store, incluindo bots de negociação, indicadores e plugins, são fornecidos por programadores terceiros e são disponibilizados apenas para fins informativos e de acesso técnico. A cTrader Store não é um corretor e não fornece aconselhamento em matéria de investimento, recomendações pessoais ou qualquer garantia de desempenho no futuro.
Mais deste autor


![Logótipo de "High-Low Divergence [Iridio Capital]"](https://cdn.ctrader.com/image/webp/443c4661-7abb-40f1-842f-4b6ec560649b_40914)


Preço
Desde 21/01/2025
3
Vendas