
E7 Polynomial Regression Channel
インジケーター
889 ダウンロード数
バージョン 1.0、Feb 2025
Windows、Mac
4.8
レビュー: 5
説明
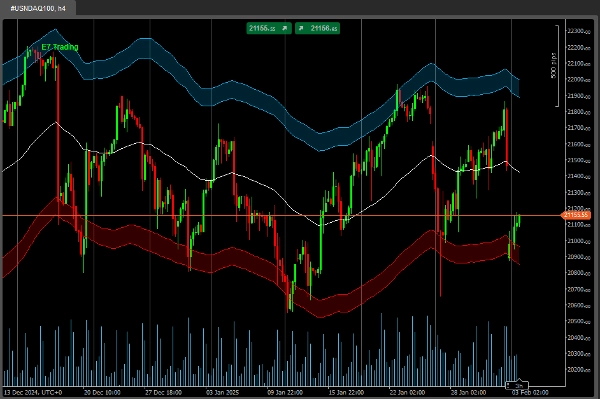
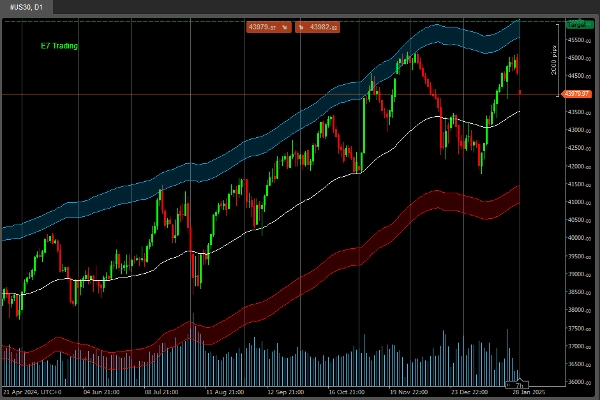
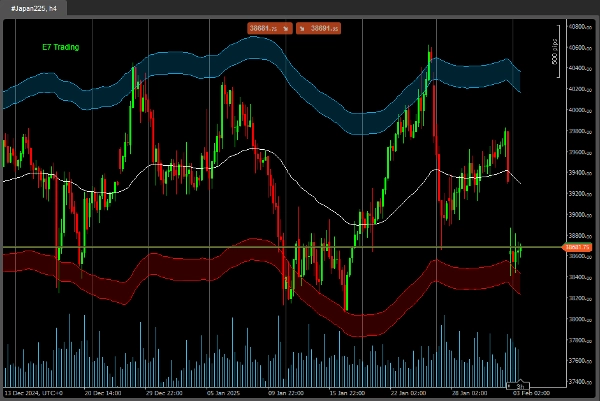
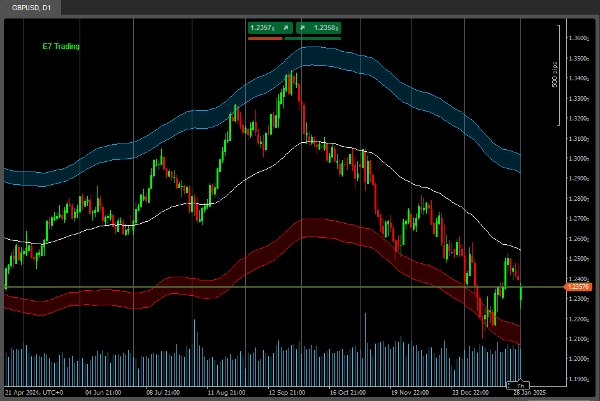
これはカスタマイズされた多項式回帰チャネルです。
これは基礎資産のボラティリティも反映しています。
これにより、E7戦略で教えられているように、より良い分析が可能になります。
ハッピー・ハンティング!
概要
AIによる概要
The E7 Polynomial Regression Channel is a customized technical indicator designed for market analysis. It applies polynomial regression to price data, creating a channel that adapts to the underlying asset's price movements. This channel also incorporates volatility measures, allowing users to assess market conditions more comprehensively. By reflecting both trend and volatility, it supports enhanced analysis consistent with the methodologies taught in the E7 Strategies. The indicator is intended for use in trading platforms to assist traders in identifying potential price channels and volatility shifts.
インジケーターのプロフィール
カスタマーレビュー
4.8
レビュー: 5
5 | 80 % | |
4 | 20 % | |
3 | 0 % | |
2 | 0 % | |
1 | 0 % |
カスタマーレビュー
July 14, 2025
Pros: Polynomial regression with adjustable degree and deviation channels. Great for identifying trend zones and reversals. Works across timeframes. Cons: No alerts or tooltips. High polynomial degrees may cause lag. Lacks template saving for user settings.
May 1, 2025
This is very good Mate, i really like it, i am working o an Cbot with few indicators, could you share me this one code to include it?
ディスカッション
よくあるご質問
cTrader Storeで入手可能な取引ボット、インジケーター、プラグインなどの商品は、第三者の開発者が提供するものであり、情報と技術の取得のみを目的としてご利用いただけます。cTrader Storeはブローカーではなく、投資助言や個人的な推奨を行うことも、将来のパフォーマンスを保証することもありません。
この作成者の他の商品


![「[Stellar Strategies] Smart ADX」ロゴ](https://cdn.ctrader.com/image/webp/af13b084-b6f6-41db-b7bc-c7e688b57b05_36929)
価格
登録日 18/12/2024
2
販売
4.26K
無料インストール