Trading product for SC RSI Dots インジケーター RSI, image 1
インジケーター
38 ダウンロード数
バージョン 1.3、Jun 2026
Windows、Mac
Trading product for SC RSI Dots インジケーター RSI, image 2
Trading product for SC RSI Dots インジケーター RSI, image 3
登録日 04/01/2026
249
無料インストール

SC RSI Dots

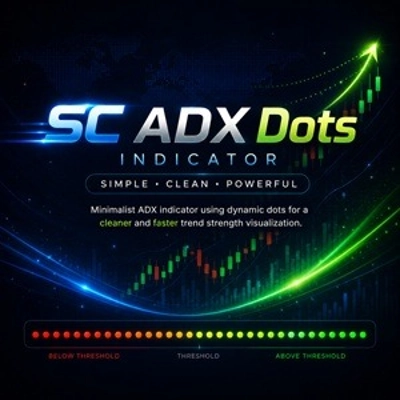
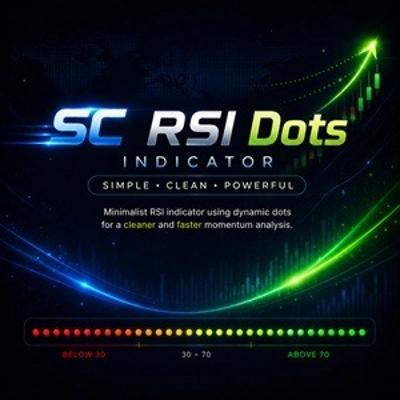
よりクリーンで迅速なモメンタムの視覚化のための動的ドットを使用したミニマリストRSIインジケーター。

SC RSI Dotsは、クラシックなRSI(相対力指数)をミニマリストに解釈したもので、不要なラインでチャートを煩雑にすることなく、市場のモメンタムをよりクリーンで直感的に表示するよう設計されています。

従来のRSIラインを表示する代わりに、このインジケーターは時間経過に伴うRSI値を表す動的なドットを使用します。

このアプローチにより、特に複数のツールを同時に使用するトレーダーにとって読みやすい、よりクリーンでモダンなチャートレイアウトが作成されます。

主な特徴

  • ラインの代わりにドットで表示されるRSI
  • よりクリーンで気を散らさないチャートの外観
  • RSIの位置に基づく動的な色の視覚化
  • 売られ過ぎ状態専用の色
  • 買われ過ぎ状態専用の色
  • RSIが極端なレベルに近づくにつれて進行的に強くなる色の濃さ
  • モメンタムの変化を即座に視覚的に識別
  • 市場の強さと弱さを迅速に認識
  • スキャルピング、日中取引、裁量取引に最適


カラ―システムの仕組み

SC RSI Dotsは、RSIの解釈を簡素化する動的なカラ―エンジンを使用しています。

  • 専用の色が売られ過ぎ状態を識別します。
  • 専用の色が買われ過ぎ状態を識別します。
  • これら二つのゾーンの間では、RSIがいずれかの極端な値に近づくにつれて色の濃さが徐々に増加します。

この視覚的アプローチにより、トレーダーは従来のオシレーターラインを常に監視することなく、モメンタムがどこで発生しているかを即座に理解できます。

その結果、チャートから直接RSIの状態をより速く、より直感的に読み取ることができます。


なぜSC RSI Dotsを使うのか

従来のRSIインジケーターは、トレーダーがオシレーターラインとその買われ過ぎ・売られ過ぎレベルとの相互作用を継続的に監視する必要があることが多いです。

SC RSI Dotsは一つの目標を持って作られました:

チャートを視覚的にクリーンに保ちながら、モメンタムと市場状況に関するすべての重要な情報を提供すること。

適応的なドットの視覚化により、以下を簡単に認識できます:

  • 強まる強気のモメンタム
  • 強まる弱気のモメンタム
  • 買われ過ぎ状態に近づく動き
  • 売られ過ぎ状態に近づく動き
  • モメンタムの潜在的な消耗

画面上の追加のラインによる気を散らす要素なしに。


こんな方に最適

  • クリーンなチャートを好むトレーダー
  • モメンタムトレーダー
  • プライスアクショントレーダー
  • スキャルパーやデイトレーダー
  • 複数インジケーターを使ったトレード設定
  • 迅速な市場分析


重要な注意点

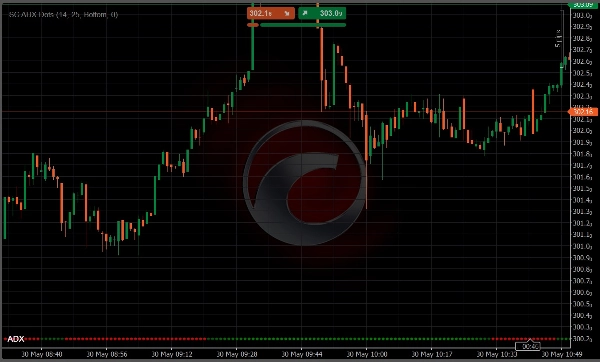
SC RSI Dotsはメインの価格チャート上で直接使用するよう設計されています。

従来のRSIインジケーターとは異なり、その視覚的コンセプトはモメンタム情報をプライスアクション分析に統合することを中心に構築されています。このため、インジケーターを別パネルで使用することは推奨されず、意図したユーザー体験を提供しません。


シンプル。クリーン。直感的。

インジケーターのプロフィール
インジケーターのカテゴリー
モメンタム
出力の種類
ビジュアル表示
シグナル
データ要件
バーのみ
サポート対象のシグナル
反転
トレンドの強さ
ラインタッチ
ラインブレイク
0.0
レビュー: 0
カスタマーレビュー
この商品にはまだレビューがありません。お使いになったことがある方は、ぜひレビューをお願いします。
RSI
cTrader Storeで入手可能な取引ボット、インジケーター、プラグインなどの商品は、第三者の開発者が提供するものであり、情報と技術の取得のみを目的としてご利用いただけます。cTrader Storeはブローカーではなく、投資助言や個人的な推奨を行うことも、将来のパフォーマンスを保証することもありません。

この作成者の他の商品

インジケーター
Market Structure
Automatic market structure detection with HH, HL, LH and LL labels directly on the chart.
インジケーター
ATR
Key Levels
+2
Professional support & resistance detection with adaptive bands and smart signals.
インジケーター
ATR
ATR-based trailing stop that adapts to volatility, protects profits, and follows trends automatically.
インジケーター
MACD
Dynamic MACD histogram dots with smart crossing signals for faster momentum analysis.
インジケーター
ADX
Minimalist ADX indicator using dynamic dots for a cleaner and faster trend strength visualization.

これも好きかも

インジケーター
Forex
NZDUSD
+2
RCS: 8 majors! AUD,USD,EUR,JPY,GBP,CAD,CHF,NZD. Find how strong each currency is relatively and trade smarter!
インジケーター
SMC
VWAP
+16
It calculates Anchored VWAP and StdDev bands from a user-defined start date for cTrader charts.
インジケーター
XAUUSD
Commodities
A Fair Value Gap (FVG) indicator that identifies potential price imbalances, potential reversal and continuation zones
インジケーター
Key Levels
Liquidity Grab
+3
Visual market context dashboard showing bias states, CE positioning, session status and sweep context.
インジケーター
Laguerre RSI: smoother, faster RSI with less noise. Great for spotting reversals and timing entries.
インジケーター
Key Levels
Market Structure
+1
Sessions, ICT killzones, multi-ORB and previous levels. One clean, no-repaint cTrader overlay.
インジケーター
AI
ATR
+27
Overbought Oversold Indicator
インジケーター
Bollinger
Bollinger Band Cloud, Heiken Ashi, Trend Follower and Parabolic SAR.
インジケーター
Indices
Custom ADX Indicator for precise trend analysis. المؤشر المخصص ADX لتحليل الاتجاه بدقة
インジケーター
Smart Signal Reversal Trend + Patterns
インジケーター
BOS
MSS
+3
Maps BOS, CHoCH, swing breaks and market structure shifts directly on your cTrader chart.
インジケーター
Shows daily and sessions highs / lows and session boxes, everything configurable
インジケーター
SMC
Breakout
+1
Delta Peak Bubbles is a tick‑chart overlay for cTrader that highlights the strongest momentum spikes.
インジケーター
Signal
🔹 Trend-Reversal-Indicator for cTrader 🔹 The ultimate Renko chart tool!
インジケーター
EMA
SMA
+3
Pro MA Close Alert. Powerful indicator that instantly notifies you when price closes above or below your selected MA.
インジケーター
Breakout
Plots automatic psychological levels at round-number zones – major structure & liquidity levels.
インジケーター
MSS
Key Levels
+4
Maps session ranges, previous highs/lows, equilibrium and premium/discount zones on your cTrader chart.
インジケーター
Prop
Scalping
Shows bars from different Time Frame on zoom out and hides the current bars. Perfect tool for Multi TF "Market Reply"
登録日 04/01/2026
249
無料インストール