SC MACD Dots
지표
61 다운로드
버전 1.4, Jun 2026
Windows, Mac
5.0
리뷰: 1
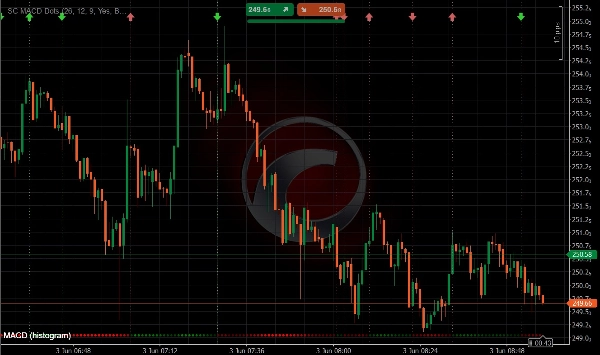
Trading product for SC MACD Dots 지표 MACD, image 2
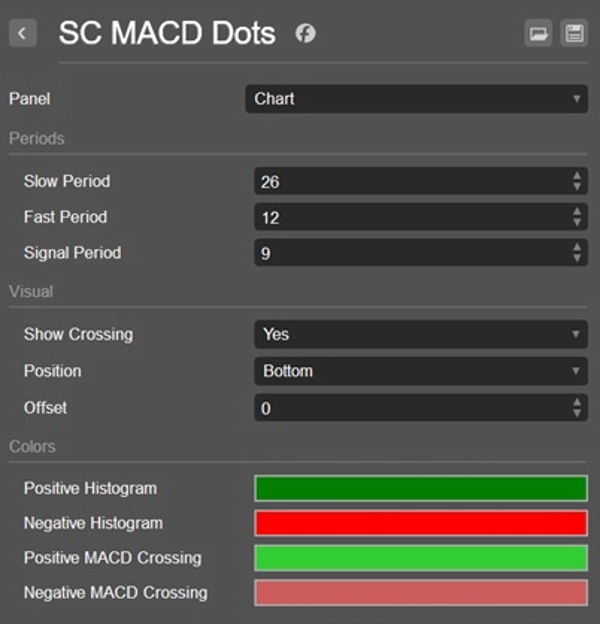
Trading product for SC MACD Dots 지표 MACD, image 3
가입일 04/01/2026
305
무료 설치

설명

SC MACD Dots

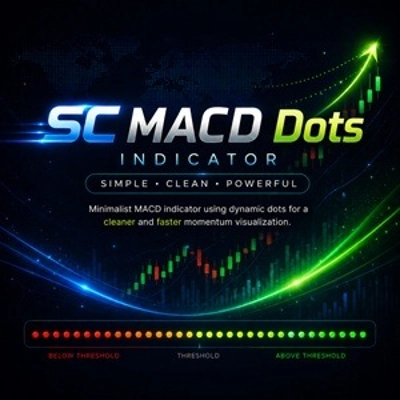
SC MACD Dots는 전통적인 히스토그램 바와 여러 선들로 차트를 복잡하게 만들지 않고 모멘텀을 더 깔끔하고 직관적으로 보여주기 위해 고안된 고전적인 MACD 지표의 미니멀리스트 버전입니다.

표준 MACD 히스토그램을 표시하는 대신, 이 지표는 시간에 따른 히스토그램 값을 나타내기 위해 동적인 점들을 사용합니다. 이 접근법은 트레이더가 모멘텀 변화, 추세 가속, 잠재적 반전을 즉시 식별할 수 있도록 하는 현대적이고 시각적으로 효율적인 레이아웃을 만듭니다.

점들은 히스토그램 강도에 따라 색상과 강도를 조절하여 모멘텀의 증가 또는 감소를 한눈에 쉽게 인식할 수 있게 합니다.

또한, SC MACD Dots는 MACD 신호선 교차를 자동으로 강조하여 트레이더가 잠재적 추세 변화와 모멘텀 변화를 빠르게 식별할 수 있도록 합니다.

주요 특징

• 전통적인 바 대신 동적인 점으로 표시되는 히스토그램
• 더 깔끔하고 덜 산만한 차트 외관
• 히스토그램 강도에 따라 동적으로 변하는 점의 색상과 강도
• 증가 및 감소하는 모멘텀의 즉각적인 시각적 식별
• MACD 교차 이벤트의 자동 감지
• 상승 및 하락 교차에 대한 서로 다른 색상
• 양수 구역과 음수 구역 교차에 대한 서로 다른 시각적 스타일
• 모멘텀 변화와 추세 반전의 빠른 시각적 해석
• 스캘핑, 일중 거래, 스윙 거래 및 재량 거래에 이상적

교차 시각화

SC MACD Dots는 모든 MACD 교차 이벤트를 강조합니다:

• 상승 교차(강세)는 전용 강세 색상으로 표시됩니다
• 하락 교차(약세)는 전용 약세 색상으로 표시됩니다
• 0선 위(양수 MACD 영역)에서 발생하는 교차는 0선 아래(음수 MACD 영역)에서 발생하는 교차와 다른 색상 체계를 사용합니다
• 이를 통해 트레이더는 강한 모멘텀 신호와 약한 신호를 즉시 구분할 수 있습니다

SC MACD Dots를 사용하는 이유

전통적인 MACD 지표는 종종 트레이더가 여러 선과 히스토그램 바를 동시에 모니터링해야 하므로 차트가 복잡하고 읽기 어려워질 수 있습니다.

SC MACD Dots는 한 가지 목표를 가지고 만들어졌습니다:

모든 필수 모멘텀 정보를 유지하면서 MACD 분석을 단순화하는 것.

적응형 점 시각화는 불필요한 시각적 요소의 방해 없이 트레이더가 히스토그램 강도, 모멘텀 가속, 모멘텀 감속 및 교차 신호를 빠르게 평가할 수 있게 합니다.

동적 히스토그램 점과 지능적인 교차 시각화를 결합함으로써 트레이더는 기회를 더 빠르게 식별하고 더 깔끔한 거래 작업 공간을 유지할 수 있습니다.

적합 대상

• 깔끔한 차트를 선호하는 트레이더
• 모멘텀 트레이더
• 스캘퍼 및 일중 트레이더
• 스윙 트레이더
• 다중 지표 거래 설정
• 빠른 시장 분석
• MACD 교차 신호에 의존하는 트레이더

중요 참고 사항

SC MACD Dots는 메인 가격 차트에 직접 사용하도록 설계되었습니다.

전통적인 MACD 지표와 달리, 이 지표의 시각적 개념은 모멘텀 정보를 가격 행동 분석에 통합하는 데 중점을 두고 있습니다. 따라서 별도의 패널에서 지표를 사용하는 것은 권장되지 않으며 의도한 사용자 경험을 제공하지 않습니다.


간단함. 깔끔함. 강력함.

요약

AI 요약
SC MACD Dots is a momentum indicator that simplifies the classic MACD by replacing traditional histogram bars with dynamic dots on the main price chart. These dots vary in color and intensity to represent histogram strength, enabling quick visual assessment of momentum changes, acceleration, and deceleration. The indicator automatically highlights MACD signal-line crossings with distinct colors for bullish and bearish signals, differentiating crossings above and below the zero line to indicate stronger or weaker momentum. Designed for scalping, intraday, swing, and discretionary trading, SC MACD Dots offers a cleaner, less cluttered chart appearance that integrates momentum analysis directly with price action. It supports signals for crossovers, reversals, trend strength, and divergence, relying solely on bar data. This tool is suited for traders who prefer minimalist visuals and faster interpretation of momentum shifts and trend reversals.
지표 프로필
지표 카테고리
모멘텀
출력 유형
신호
시각화
데이터 요구 사항
막대만
지원되는 신호
크로스
반전
추세 강도
다이버전스

고객 리뷰

5.0
리뷰: 1
5
100 %
4
0 %
3
0 %
2
0 %
1
0 %
고객 리뷰
July 19, 2026
SC MACD Dots is a brilliant minimalist take on the classic MACD. By replacing cluttered histogram bars with dynamic dots plotted directly on the price chart, it seamlessly integrates momentum data into your price action analysis. The smart crossing arrows, which differentiate between signals above and below the zero line, provide instant visual feedback. While it lacks alerts and can whipsaw in flat markets, it’s a lightweight, highly effective tool for traders who value clean charts.

상담

자주 묻는 질문(FAQ)

MACD
트레이딩 봇, 지표, 플러그인 등 cTrader Store에서 제공되는 상품은 제3자 개발자에 의해 제공되며, 이는 단순히 정보 및 기술적 접근을 목적으로 제공된 것입니다. cTrader Store는 중개인이 아니며, 투자 조언, 개인별 추천 또는 향후 성과에 대한 어떠한 보장도 제공하지 않습니다.

이 작성자의 상품 더 보기

지표
Market Structure
Automatic market structure detection with HH, HL, LH and LL labels directly on the chart.
지표
ATR
Key Levels
+2
Professional support & resistance detection with adaptive bands and smart signals.
지표
ATR
ATR-based trailing stop that adapts to volatility, protects profits, and follows trends automatically.
지표
ADX
Minimalist ADX indicator using dynamic dots for a cleaner and faster trend strength visualization.
지표
RSI
Minimalist RSI dots with dynamic colors for instant momentum and extreme zone recognition.

좋아하실 만한 다른 항목

지표
ATR
Fibonacci
+4
Emperor Signals Pro is a premium non-repainting indicator for Forex pairs on the 15-minute timeframe
지표
RSI
MACD
+7
The ZigZag indicator is a technical analysis tool primarily used to identify key price reversal points.
지표
Plots intraday VWAP and dynamic ±1/±2 standard deviation (SD) bands based on current day’s price and volume.
지표
VWAP
Volume
+2
VWAP Stdev Heatmap: Advanced daily VWAP with 5-tier standard deviation bands and dynamic candlestick coloring.
지표
Prop
Forex
+11
🧭 See when your market tends to move—by Month, Day-of-Week, or Hour-of-Day🧭
지표
Forex
Indices
+1
Professional Fair Value Gaps with multitimeframe spot on
지표
Drawdown Monitor
Proprietary trading desk risk monitoring dashboard!
지표
POSITION SIZE CALCULATOR
지표
MACD
Forecast future prices using historical MACD trends. Features a probability fan for smart entries and dynamic targets.
지표
This indicator can be used to: change color, shape size, position, change font, increase or decrease, and other function
지표
AI
SMC
+4
Weekly Daily Opening Gaps — NWOG & NDOG Indicator Professional-grade opening gap visualization for institutional traders
지표
MACD
Forex
+2
a revolutionary indicator that integrates volume into MACD.
지표
Key Levels
Liquidity Grab
+3
Visual market context dashboard showing bias states, CE positioning, session status and sweep context.
지표
Signal
"Buy Sell Prize: The indicator that reveals market secrets. Precise signals to buy, sell, and profit. Your ultimate trad
지표
EMA
VWAP
+2
ORB Range Indicator maps the opening range and gives a practical session-breakout workflow with clear labels.
지표
VWAP
Forex
+2
Custom VWAP Indicator for cTrader
지표
Shows daily and sessions highs / lows and session boxes, everything configurable
지표
Prop
Forex
+9
Trend Sniper — session-based tool highlighting live session ranges and adaptive Custom line.

가격

가입일 04/01/2026
305
무료 설치