
설명
Pinescriptlabs 스토어 지표: 🤖Pinescriptlabs 스토어 cBots : (cBot) Gold & BTC BreakoutSession Pivots(new)
Prediction Based on Linreg & ATR
SmartTrend Support &
Resistance
Lines
Dynamic
Market Structure
Analysis
of
Turning
Points
Fibonacci
Linear
Regression
Multi-timeframe
Multi-Level
Candle Bias
Tracker
Auto
Support and
Resistance
Trend
Lines
All
Support and
Resistance
Levels
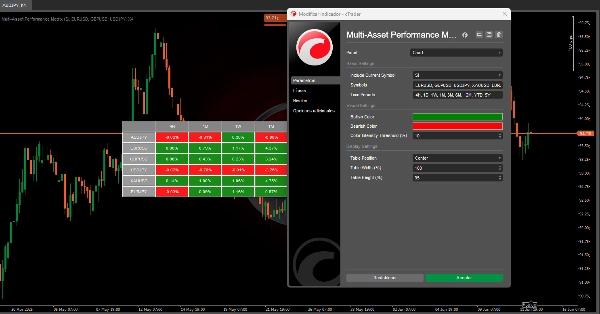
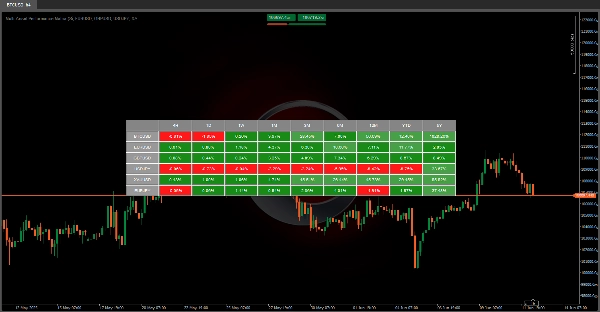
🚀 다중 자산 성과 매트릭스 🚀
이 알고리즘은 강력한 시각 도구 📊로, 다양한 기간에 걸쳐 여러 금융 상품의 백분율 성과를 표시하도록 설계되었습니다.
과거 데이터를 효율적이고 직관적인 시각화로 변환하여 사용자가 다양한 금융 자산의 동향을 빠르게 평가할 수 있도록 합니다.
❓ 이 도구는 무엇을 하나요?
1️⃣ 📈 자산 비교: BTCUSD, EURUSD, XAUUSD 등 다양한 금융 상품의 가격 변동을 시간에 따라 보여줍니다.
- 시간 프레임: D (일간) | 1W (주간) | 1M (월간) | 3M (분기별) | 6M (반기별) | 12M (연간) | YTD (연초 대비) | 5Y (최근 5년)
2️⃣ 🎨 추세 강조: 색상 코딩(🟢, 🔴)을 사용하여 각 기간별로 상승 또는 하락하는 자산을 즉시 식별할 수 있습니다.
3️⃣ ⏱️ 자동 업데이트: 최신 시장 정보를 반영하기 위해 매분 데이터를 새로 고칩니다.
💡 왜 유용한가요?
✔ 📊 비교 분석: 여러 자산을 나란히 비교할 수 있어 포트폴리오 관리나 시간대별로 성과가 좋은 자산 선택에 이상적입니다.
✔ 🛡️ 통제: 다양한 기간에 걸친 자산의 일관성(또는 변동성)을 평가하여 관련 위험을 판단하는 데 도움이 됩니다.
✨ 주요 사항
✅ ⏳ 시간 절약: 이 데이터를 수동으로 수집하고 계산하는 데 몇 시간이 걸리지만, 이 도구는 즉시 처리합니다!
✅ 👀 시각적 명확성: 색상 코딩 시스템 덕분에 비전문가도 쉽게 분석할 수 있습니다.
✅ 🔄 적응성: 맞춤 기호를 지원하여 관심 있는 자산을 추적할 수 있습니다.
요약
고객 리뷰
5 | 100 % | |
4 | 0 % | |
3 | 0 % | |
2 | 0 % | |
1 | 0 % |


!["Gaussian Channel [Iridio Capital]" 로고](https://cdn.ctrader.com/image/webp/7c039209-5573-4a54-a072-f9528b503103_41960)


!["[Stellar Strategies] Market Structure Breakout" 로고](https://cdn.ctrader.com/image/webp/bceec265-3247-4b11-915f-6295a29c106d_28465)


