
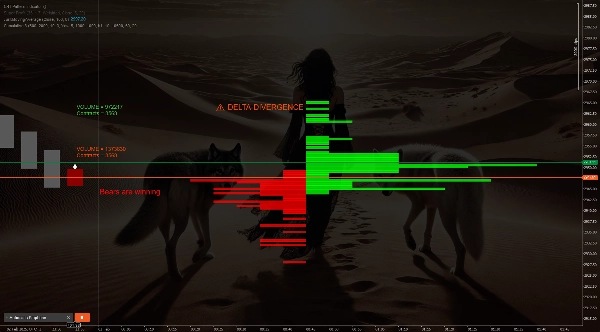
Cumulative Delta Candles + VolumeProfile
Chỉ báo
2.15K lượt tải
Phiên bản 1.0, Feb 2025
Windows, Mac
4.5
Đánh giá: 2
Mô tả
Nến delta tích lũy, Hồ sơ khối lượng, cảnh báo phân kỳ delta + tín hiệu mua bán, chúc bạn vui vẻ
Tóm tắt
Tóm tắt AI
This indicator combines cumulative delta candles with volume profile analysis to provide insights into market activity. It features delta divergence warnings and generates buy and sell signals based on the interplay of order flow and volume distribution. The tool is designed to assist traders in identifying potential market turning points by highlighting imbalances between buying and selling pressure. It integrates these elements into a single visual interface for use on trading charts.
Hồ sơ chỉ báo
Đánh giá của khách hàng
4.5
Đánh giá: 2
5 | 50 % | |
4 | 50 % | |
3 | 0 % | |
2 | 0 % | |
1 | 0 % |
Đánh giá của khách hàng
July 9, 2025
Pros: Combines cumulative delta and volume profile for precise liquidity and order flow analysis. Clear visualization, flexible settings. Stable performance. Cons: No alerts or tooltips. No history of previous profiles. Requires confirmation from additional tools for trading decisions.
April 21, 2025
Thảo luận
Câu hỏi thường gặp
Các sản phẩm có sẵn trên cTrader Store, bao gồm bot giao dịch, chỉ báo và plugin, được cung cấp bởi các nhà phát triển bên thứ ba và chỉ nhằm mục đích cung cấp thông tin và tiếp cận kỹ thuật. cTrader Store không phải là nhà môi giới và không cung cấp lời khuyên đầu tư, khuyến nghị cá nhân hay bất kỳ đảm bảo nào về hiệu suất trong tương lai.


Giá
Kể từ 09/01/2025
11.78K
Cài đặt miễn phí