
설명
SC 지지선 및 저항선
모든 트레이더가 가져야 할 전문적인 지지선 및 저항선 도구
SC 지지선 및 저항선은 차트에서 동적 지지선 및 저항 구역을 자동으로 식별, 관리 및 시각화하도록 설계된 고급 가격 행동 지표입니다.
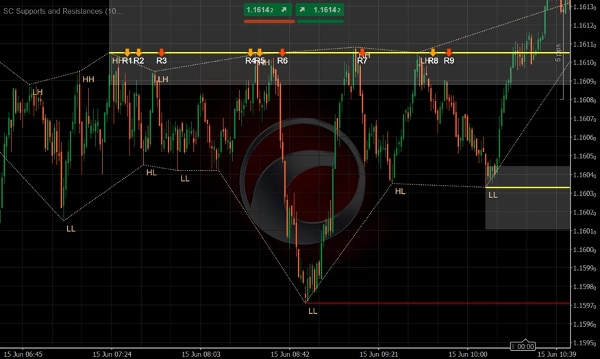
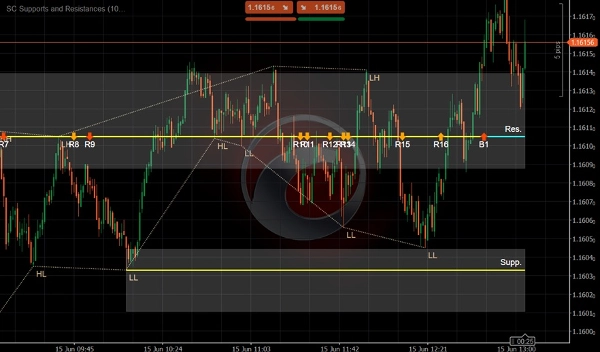
단순한 수평선에 의존하는 전통적인 지지선 및 저항선 도구와 달리, SC 지지선 및 저항선은 적응형 ATR 기반 밴드를 사용하여 현실적인 시장 반응 영역을 나타내어 트레이더가 가격이 거부, 통합 또는 돌파할 가능성이 가장 높은 위치를 이해하는 데 도움을 줍니다.
이 지표는 시장 스윙을 지속적으로 분석하여 중요한 지지선 및 저항선 수준을 감지하고, 시간이 지남에 따라 가격이 각 구역과 어떻게 상호작용하는지 추적하며, 모든 반응을 거부 또는 돌파로 자동 분류합니다. 강한 반응은 별도로 강조 표시되어 트레이더가 사소한 테스트와 의미 있는 시장 이벤트를 즉시 구분할 수 있습니다.
지능형 수준 감지, 동적 구역 관리 및 실시간 반응 분석을 결합하여, SC 지지선 및 저항선은 지지선 및 저항선 거래를 객관적이고 측정 가능한 프로세스로 전환합니다.
주요 특징
✔ 중요한 지지선 및 저항 구역 자동 감지
✔ 시장 변동성에 적응하는 동적 ATR 기반 밴드
✔ 거부 및 돌파 자동 식별
✔ 강한 거부 및 강한 돌파 감지
✔ 수준 강도 및 시장 반응 실시간 추적
✔ 가격 행동에 기반한 지능형 스윙 수준 인식
✔ 차트를 깔끔하게 유지하기 위한 오래된 수준 자동 만료
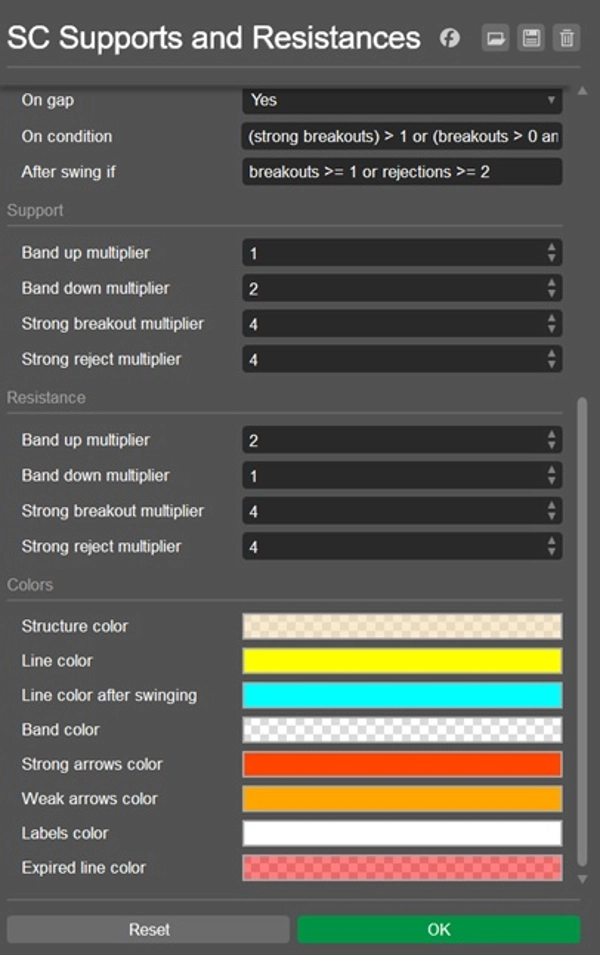
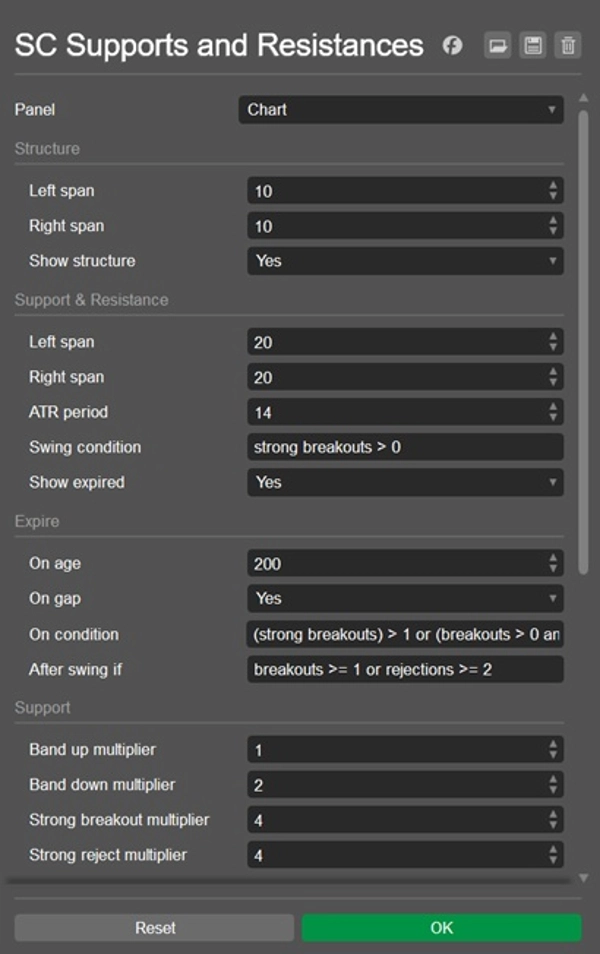
✔ 완전 맞춤형 민감도 및 반응 기준
✔ 밴드, 화살표, 라벨 및 통계로 명확한 시각적 표현
✔ 모든 시장과 모든 시간대에서 작동
고급 수준 지능
SC 지지선 및 저항선은 단순히 수준을 그리는 것 이상의 기능을 수행합니다.
감지된 모든 구역은 시장과의 상호작용에 따라 진화합니다. 이 지표는 지속적으로 다음을 모니터링합니다:
- 거부
- 돌파
- 강한 거부
- 강한 돌파
- 수준 연령
- 스윙 형성
시장 상황이 변함에 따라 수준은 자동으로 중요성을 얻거나, 중요한 스윙 수준이 되거나, 더 이상 관련이 없을 때 만료될 수 있습니다.
이는 정적인 과거 선이 아닌 실제 시장 행동을 반영하는 생동감 있는 지지선 및 저항선 프레임워크를 만듭니다.
단일 선 대신 동적 밴드
시장은 거의 정확한 가격에 반응하지 않습니다.
이러한 이유로, SC 지지선 및 저항선은 모든 수준을 동적 가격 구역으로 나타내며, 그 크기는 ATR 계산을 통해 변동성에 자동으로 적응합니다.
이는 중요하지 않은 가격 침투로 인한 잘못된 신호를 줄이면서 공급 및 수요 영역을 보다 현실적으로 표현합니다.
그 결과 시장 참여자들이 실제로 가격을 방어하는 위치를 더 깨끗하고 정확하게 볼 수 있습니다.
반응 기반 거래 신호
지지선 또는 저항 구역과의 모든 상호작용은 실시간으로 평가됩니다.
가격이 구역을 거부할 때 지표는 명확한 방향성 신호를 생성합니다. 가격이 수준을 성공적으로 돌파하면 돌파 신호가 생성되고 그 강도에 따라 분류됩니다.
이를 통해 트레이더는 즉시 다음을 식별할 수 있습니다:
- 잠재적 반전 기회
- 추세 지속 설정
- 돌파 확인
- 실패한 돌파 시도
- 높은 관심도의 기관 반응 구역
자동 수준 수명 주기 관리
지지선 및 저항선 거래에서 가장 큰 도전 과제 중 하나는 수준이 더 이상 유효하지 않을 때를 결정하는 것입니다.
SC 지지선 및 저항선은 다음을 기반으로 한 지능형 만료 논리를 통해 모든 수준의 전체 수명 주기를 자동으로 관리합니다:
- 시장 비활성
- 가격 갭
- 돌파 행동
- 거부 행동
- 스윙 확인 논리
그 결과 차트는 여전히 중요한 수준에만 집중하여 불필요한 혼란과 오래된 정보를 제거합니다.
왜 SC 지지선 및 저항선을 사용해야 하는가
지지선과 저항선은 기술적 분석에서 가장 중요한 개념 중 하나로 남아 있지만, 많은 트레이더가 여전히 수동으로 수준을 그려 주관적인 해석과 일관성 없는 결과를 초래합니다.
SC 지지선 및 저항선은 주요 시장 수준을 식별하고 관리하는 객관적이고 규칙 기반의 접근 방식을 제공하여 이러한 불확실성을 제거합니다.
이를 통해 트레이더는 다음을 할 수 있습니다:
✔ 높은 확률의 반응 구역을 더 빠르게 식별
✔ 지지선 및 저항선 수준의 강도 측정
✔ 의미 있는 돌파 및 거부를 즉시 감지
✔ 진입 및 청산 타이밍 개선
✔ 차트 혼란 감소
✔ 더 큰 자신감과 일관성으로 거래
적합 대상
- 가격 행동 트레이더
- 스캘퍼
- 데이 트레이더
- 스윙 트레이더
- 추세 트레이더
- 스마트 머니 컨셉(SMC) 트레이더
- 지지선 및 저항선 트레이더
- 전문 기술 분석가
중요 참고 사항
SC 지지선 및 저항선은 확인된 시장 피벗과 적응형 변동성 계산을 사용하여 수준을 식별합니다.
생성된 수준의 품질과 빈도는 선택한 민감도 설정 및 반응 매개변수에 따라 달라집니다.
이 설정을 조정하면 트레이더가 다양한 시장, 거래 스타일 및 시간대에 맞게 지표를 맞춤화할 수 있습니다.
수준을 식별하세요. 반응을 측정하세요.
중요한 것을 거래하세요.
요약
Key functionalities include automatic detection and expiration of levels, intelligent swing-level recognition, and customizable sensitivity settings. Visual outputs feature dynamic bands, arrows, labels, and statistics to clearly represent zones and market reactions. This tool supports all markets and timeframes, providing objective, rules-based identification of key price levels to assist traders in recognizing potential reversals, trend continuations, breakout confirmations, and institutional reaction zones.
SC Supports & Resistances is suitable for various trading styles, including price action, scalping, day trading, swing trading, trend trading, and Smart Money Concept approaches. It aims to reduce chart clutter and improve entry and exit timing by maintaining a living framework of relevant support and resistance levels that evolve with market behavior.


