SC RSI Dots
Indicator
40 downloads
Version 1.3, Jun 2026
Windows, Mac
Trading product for SC RSI Dots Indicator RSI, image 2
Trading product for SC RSI Dots Indicator RSI, image 3
Since 04/01/2026
270
Free installs

Description

SC RSI Dots

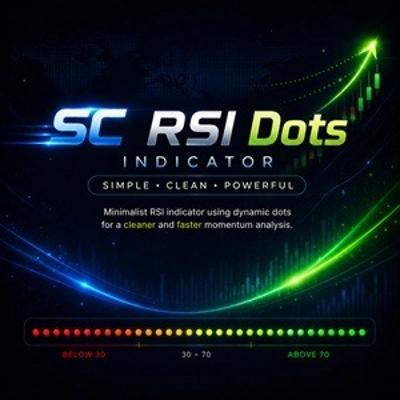
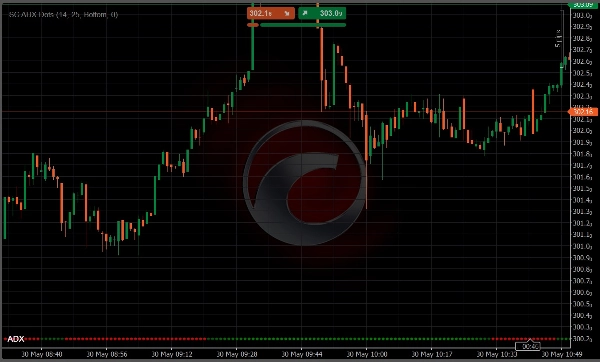
Minimalist RSI indicator using dynamic dots for a cleaner and faster momentum visualization.

SC RSI Dots is a minimalist interpretation of the classic RSI (Relative Strength Index), designed to provide a cleaner and more intuitive view of market momentum without cluttering the chart with unnecessary lines.

Instead of displaying the traditional RSI line, the indicator uses dynamic dots to represent RSI values over time.

This approach creates a cleaner, more modern chart layout that is easier to read, especially for traders who use multiple tools simultaneously.

Key Features

  • RSI displayed using dots instead of lines
  • Cleaner and less distracting chart appearance
  • Dynamic color visualization based on RSI position
  • Dedicated color for Oversold conditions
  • Dedicated color for Overbought conditions
  • Progressive color intensity as RSI approaches extreme levels
  • Instant visual identification of momentum shifts
  • Quick recognition of market strength and weakness
  • Ideal for scalping, intraday trading, and discretionary trading


How the Color System Works

SC RSI Dots uses a dynamic color engine to simplify RSI interpretation.

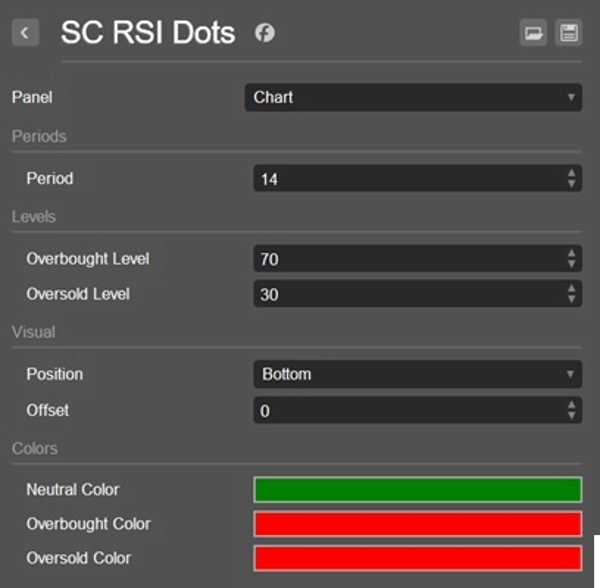
  • A dedicated color identifies Oversold conditions.
  • A dedicated color identifies Overbought conditions.
  • Between these two zones, color intensity gradually increases as RSI approaches either extreme.

This visual approach allows traders to instantly understand where momentum is developing without constantly monitoring a traditional oscillator line.

The result is a faster and more intuitive reading of RSI conditions directly from the chart.


Why Use SC RSI Dots

Traditional RSI indicators often require traders to continuously monitor the oscillator line and its interaction with overbought and oversold levels.

SC RSI Dots was created with one goal in mind:

to keep the chart visually clean while still providing all the essential information about momentum and market conditions.

The adaptive dot visualization makes it easy to recognize:

  • Increasing bullish momentum
  • Increasing bearish momentum
  • Approaching Overbought conditions
  • Approaching Oversold conditions
  • Potential momentum exhaustion

All without the distraction of additional lines across the screen.


Perfect For

  • Traders who prefer clean charts
  • Momentum traders
  • Price action traders
  • Scalpers and day traders
  • Multi-indicator trading setups
  • Fast market analysis


Important Note

SC RSI Dots is designed to be used directly on the main price chart.

Unlike traditional RSI indicators, its visual concept is built around integrating momentum information into price action analysis. For this reason, using the indicator in a separate panel is not recommended and does not provide the intended user experience.


Simple. Clean. Intuitive.

Summary

AI summary
SC RSI Dots is a minimalist Relative Strength Index (RSI) indicator designed to display momentum on the main price chart using dynamic colored dots instead of the traditional RSI line. This approach provides a cleaner, less cluttered visual that integrates momentum information directly with price action, facilitating faster and more intuitive market analysis.
Key features include:
- RSI values represented by dots with dynamic colors reflecting momentum strength.
- Distinct colors for oversold and overbought conditions.
- Progressive color intensity indicating proximity to extreme RSI levels.
- Instant visual cues for momentum shifts, market strength, and weakness.
The indicator is suitable for scalping, intraday, momentum, and price action traders who prefer clean charts and use multiple tools simultaneously. It supports visualization of reversal signals, trend strength, and level touches or breaks based on RSI behavior. SC RSI Dots is intended for use on the main price chart rather than a separate panel, enhancing direct correlation between momentum and price movements.
Indicator profile
Indicator category
Momentum
Output type
Visualisation
Signals
Data requirements
Bars only
Supported signals
Reversal
Trend strength
Level touch
Level break

Customer reviews

0.0
Reviews: 0
Customer reviews
No reviews for this product yet. Already tried it? Be the first to tell others!

Discussion

FAQ

RSI
Products available through cTrader Store, including trading bots, indicators and plugins, are provided by third-party developers and made available for informational and technical access purposes only. cTrader Store is not a broker and does not provide investment advice, personal recommendations or any guarantee of future performance.

More from this author

Indicator
Market Structure
Automatic market structure detection with HH, HL, LH and LL labels directly on the chart.
Indicator
ATR
Key Levels
+2
Professional support & resistance detection with adaptive bands and smart signals.
Indicator
ATR
ATR-based trailing stop that adapts to volatility, protects profits, and follows trends automatically.
Indicator
MACD
Dynamic MACD histogram dots with smart crossing signals for faster momentum analysis.
Indicator
ADX
Minimalist ADX indicator using dynamic dots for a cleaner and faster trend strength visualization.

You may also like

Indicator
ATR
Prop
+14
📊 Automatically plots Fibonacci retracement and extension levels based on the most recent significant price movements.
Indicator
Prop
Forex
+4
This is an indicator that can alert you about trendlines, horizontal lines and vertical lines.
Indicator
MSS
Market Structure
+2
Smart structural zones with pivot detection, ATR adaptation, sound alerts, and auto-color UI for precise entries.
Indicator
EMA
SMA
+5
Trend Blueprint All-in-One Trend & Structure
Indicator
Drawdown Monitor
Proprietary trading desk risk monitoring dashboard!
Indicator
Forex
EURUSD
+5
Fimathe Indicator - Fimathe PCM - Automated Trend Channels & Levels — Ideal for live trading and backteting
Indicator
ATR
Forex
+3
LevelMaster S/R: Pinpoint key support & resistance zones with precision. Perfect for traders of all levels Trade smarter
Indicator
Alpha Sentiment Pro - See the Market's Pulse Before It Moves
Indicator
Key Levels
Liquidity Grab
+3
Visual market context dashboard showing bias states, CE positioning, session status and sweep context.
Indicator
Forex
BTCUSD
+12
🎯Automatically identifies the market's significant turning points (key H & L) and draws dynamic support and.....✍️
Indicator
Prop
Forex
+2
Vision - Advanced Session Indicator
Indicator
RSI
MACD
This indicator is a combination of MACD and RSI into one. This is perfect fusion and powerful indicator ever.
Indicator
AI
ATR
+9
Index Hunter: Momentum analysis for US30 & NAS100. Designed to identify high-velocity moves and intraday trends.
Indicator
IVB 2.0 is an indicator that works on the strategy of imbalance of the maximum volatility box of indices
Indicator
ATR
RSI
+6
💹 Define a price channel 📈 and determine trend direction (bullish 🟢 or bearish 🔴).
Indicator
ATR
Forex
+9
Auto-detect swing highs/lows. Spot reversals, map structure, and filter noise with adjustable strength.
Indicator
Signal
Scalping
Enhance Your Trading Strategy with the Larry Williams 9-5-3 Indicator
Indicator
ATR
Engulfing
+3
Multi-timeframe Bias Alignment and Supply & Demand Zones Indicator.

Price

Since 04/01/2026
270
Free installs