
ADXMultiframeIndicator
Indicador
1 compras
Versión 1.0, Oct 2025
Windows, Mac
5.0
Valoraciones: 2
Descripción
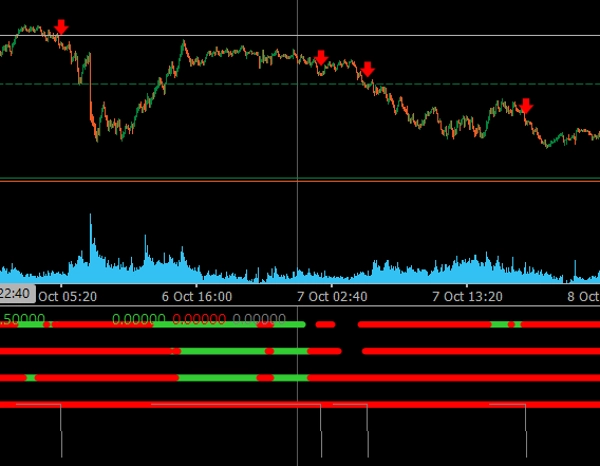
El Multi-Timeframe ADX Trend Dots & Arrows es un indicador de trading profesional para cTrader, diseñado para identificar tendencias de mercado alineadas en múltiples marcos temporales utilizando el Average Directional Movement Index (ADX).
🔹 Características clave:
- ✅ Analiza hasta 4 marcos temporales personalizables (M15, H1, H4, Diario).
- ✅ Los puntos coloreados muestran la inclinación direccional (Verde = Tendencia alcista, Rojo = Tendencia bajista).
- ✅ Flechas automáticas aparecen cuando todos los marcos temporales se alinean en la misma dirección.
- ✅ Filtro de barras consecutivas reduce señales falsas o prematuras.
- ✅ Visualización limpia y moderna optimizada para temas de gráficos oscuros y claros.
- ✅ Perfecto para detectar confirmaciones en múltiples marcos temporales y puntos de continuación de tendencia.
Este indicador es ideal para traders que quieren ver el panorama general y entrar solo cuando todos los marcos temporales estén de acuerdo, proporcionando configuraciones de trading más fuertes y confiables.
Resumen
Resumen de IA
The ADXMultiframeIndicator is a trading indicator for the cTrader platform that identifies market trends by analyzing the Average Directional Movement Index (ADX) across multiple timeframes. It supports up to four customizable timeframes, including M15, H1, H4, and Daily. The indicator displays colored dots to indicate directional bias—green for uptrends and red for downtrends—and automatically shows arrows when all selected timeframes align in the same direction. A consecutive bars filter is included to reduce false or premature signals. The visualization is designed to be clear and modern, compatible with both dark and light chart themes. This tool assists traders in confirming multi-timeframe trends and identifying trend continuation points by highlighting when all timeframes agree, facilitating more informed trade entries. It is particularly useful for analyzing indices markets.
Perfil del indicador
Valoraciones de clientes
5.0
Valoraciones: 2
5 | 100 % | |
4 | 0 % | |
3 | 0 % | |
2 | 0 % | |
1 | 0 % |
Valoraciones de clientes
October 28, 2025
the first signal should not decide the only input, but it can look better than it is during a lucky run.
Conversación
Preguntas frecuentes
Indices
Los productos disponibles a través de cTrader Store, incluidos bots, indicadores y plugins para operar, son proporcionados por desarrolladores de terceros y están disponibles únicamente con fines informativos y de acceso técnico. cTrader Store no es un bróker, por lo que no proporciona asesoramiento de inversión, recomendaciones personales ni ninguna garantía de rentabilidad futura.
Más de este autor


Precio
Desde 21/01/2025
3
Ventas