
الوصف
مؤشر فجوة القيمة العادلة
نظرة عامة
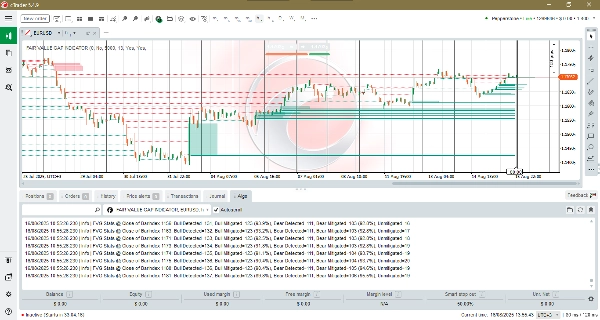
مؤشر فجوة القيمة العادلة هو أداة دقيقة لمتداولي حركة السعر الذين يرغبون في تحديد وتتبع والتحقق من اختلالات السوق قصيرة الأجل. يكتشف تلقائيًا فجوات القيمة العادلة الصعودية والهبوطية (FVGs)، ويسلط الضوء على المناطق النشطة (غير المعالجة) على الرسم البياني الخاص بك، ويسجل متى يقوم السعر لاحقًا بملء (معالجة) تلك المناطق. خفيف الوزن ولا يعيد الرسم (يعمل على الأشرطة المغلقة)، تم تصميم هذا المؤشر لتحليل موثوق في التداول المباشر والاختبار الخلفي.
الميزات الرئيسية
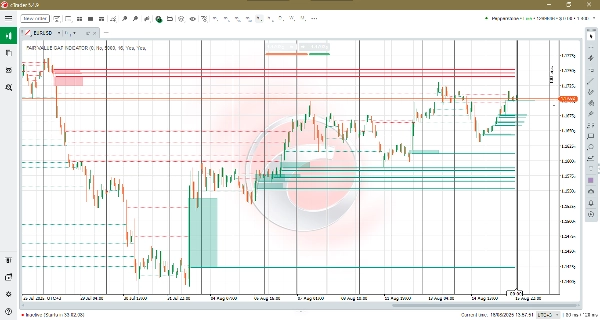
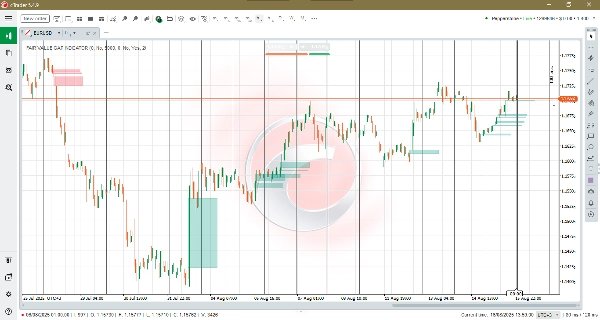
- الكشف التلقائي عن FVG: منطق قوي يعتمد على 3 أشرطة يحدد مناطق الاختلال الصعودية والهبوطية ويرسم مناطق مستطيلة نظيفة على الرسم البياني.
- تتبع المعالجة: عندما يغلق السعر عبر منطقة، يقوم المؤشر بإزالة الصندوق ويمكنه رسم خط معالجة منقط مستمر للرجوع التاريخي.
- تراكب المستوى غير المعالج: يعرض أحدث N مستويات غير مملوءة كخطوط أفقية عريضة مرسومة من شريط الكشف إلى الشريط الجاري تكوينه. هذا يجعل من السهل مسح فجوات القيمة العادلة النشطة (غير المعالجة) بصريًا وتحديد مستويات السعر بسرعة.
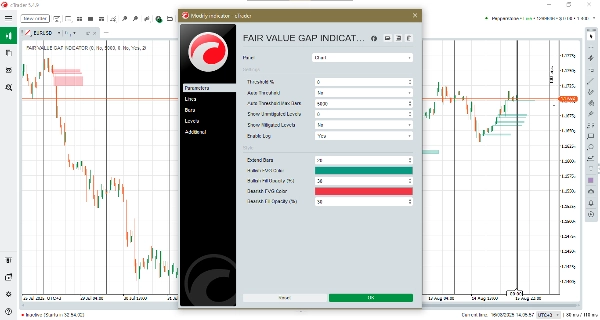
- التحديد اليدوي والتلقائي للعتبة: اختر عتبة نسبية ثابتة أو فعّل العتبة التلقائية لتمكين المؤشر من التكيف مع نشاط السوق الأخير.
- الحد الأقصى لأشرطة العتبة التلقائية: يتحكم في حجم نافذة الانزلاق المستخدمة لحساب العتبة التلقائية. القيم الأكبر تجعل العتبة أكثر سلاسة (مستقرة على مدى تاريخ أطول)؛ القيم الأصغر تجعلها أكثر استجابة للتقلبات الأخيرة.
- المرئيات المخصصة والإسقاط: اضبط طول الامتداد (مدى إسقاط الصناديق)، اللون وشفافية التعبئة للمناطق الصعودية والهبوطية لتتناسب مع نمط الرسم البياني الخاص بك.
- تسجيل الطرفية: تقارير خطوط السجل المدمجة إجمالي FVGs المكتشفة، المعالجات وعدد الحالات غير المعالجة الحالية — مثالية للتحقق وضبط الاستراتيجية.
- منطق الأشرطة المغلقة: مصمم للعمل مرة واحدة لكل شريط مغلق لتقليل إعادة الرسم.
الفوائد
- مراجع تداول واضحة: اعثر بسرعة على مناطق الاختلال التي قد تعمل كأهداف عودة، مناطق رد فعل، أو مراجع لإدارة التداول.
- التحقق والإحصائيات: استخدم سجلات الطرفية ونسب المعالجة للتحقق من الإشارات وضبط الحساسية لاستراتيجيتك.
- حساسية قابلة للتكيف: العتبة التلقائية + الحد الأقصى للأشرطة يسمحان للمؤشر بالتصرف بشكل موثوق عبر الأسواق الهادئة والمتقلبة دون إعادة ضبط يدوية مستمرة.
- مرئيات مدمجة وغير متطفلة: بصمة بصرية قليلة تحافظ على قابلية قراءة الرسوم البيانية مع الحفاظ على السياق الأساسي.
مثالي لـ
متداولي اليوم، متداولي التأرجح والمتداولين السريعين الذين يعتمدون على حركة السعر ومفاهيم الاختلال، بالإضافة إلى المحللين الذين يتحققون من ردود فعل تدفق الأوامر وأداء الاستراتيجية.
الخلاصة
يجمع مؤشر فجوة القيمة العادلة بين الكشف الدقيق عن الاختلالات مع تحليلات المعالجة والعتبة التكيفية، مما يمنحك رؤية مركزة ومنخفضة الضوضاء لاختلالات السوق. استخدمه لاكتشاف احتمالات عودة السعر، إدارة التداولات بذكاء أكبر، وقياس مدى تكرار ملء المناطق في سوقك.
الملخص
Key features include automated FVG detection, mitigation tracking, and an overlay showing recent unmitigated levels as bold horizontal lines for easy visual scanning. Users can select manual or automatic thresholding to adapt sensitivity to market conditions, with adjustable parameters controlling the responsiveness of the auto threshold. Customizable visual settings allow traders to tailor the appearance of bullish and bearish zones.
The indicator operates on closed bars to minimize repainting, ensuring reliable signals for live trading and backtesting. Terminal logging provides concise statistics on detected gaps and mitigations, aiding validation and strategy tuning.
Suitable for day traders, swing traders, scalpers, and analysts, the Fair Value Gap Indicator supports markets including Forex, indices, commodities, cryptocurrencies, and stocks. It offers a focused, low-noise view of market imbalances to assist in identifying potential price return targets and managing trades.
تقييمات العملاء
5 | 100 % | |
4 | 0 % | |
3 | 0 % | |
2 | 0 % | |
1 | 0 % |


![شعار "[Hamster-Coder] Moving Average MTF"](https://cdn.ctrader.com/image/webp/b11b98b1-194d-4b8e-b00e-d611826ad159_31226)


