
VegaXLR - Analysis Tools Alerts
インジケーター
2 購入済
バージョン 1.1、Apr 2026
Windows、Mac
4.5
レビュー: 2
説明
cTrader Analysis Tools Alertsは、さまざまな描画ツールにアラート、ラベル、自動色分けを追加してチャート体験を向上させるためのオールインワンインジケーターです。
特徴:
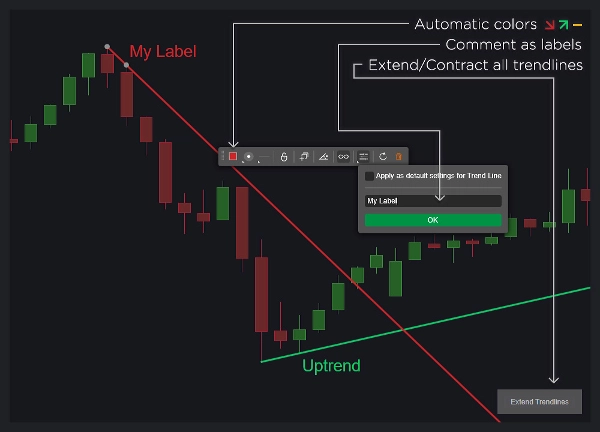
- トレンドライン:
-
- オブジェクトコメントを使用してカスタムラベルを表示。
- トレンドラインの方向に基づく動的な色の変化。
- アラート後にトレンドラインを削除するオプション。
- トレンドライン固有のアラートを有効または無効にする。
- ワンクリックで全てのトレンドラインを延長または縮小。
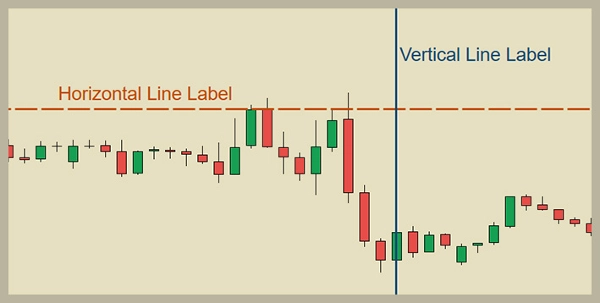
- 水平線と垂直線:
-
- オブジェクトコメントを使用してカスタムラベルを表示。
- アラート後に線を自動的に削除。
- 各線種のアラートを設定。
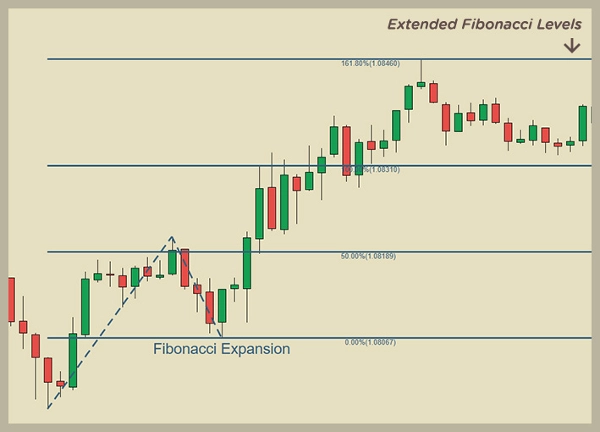
- フィボナッチのリトレースメントとエクスパンションレベル:
-
- オブジェクトコメントを使用してカスタムラベルを表示。
- レベルラインを無限に自動延長。
- アラート後にオブジェクトを削除するオプション。
- 描画方向に基づいて色を割り当て。
- フィボナッチレベルのアラートを有効または無効にする。
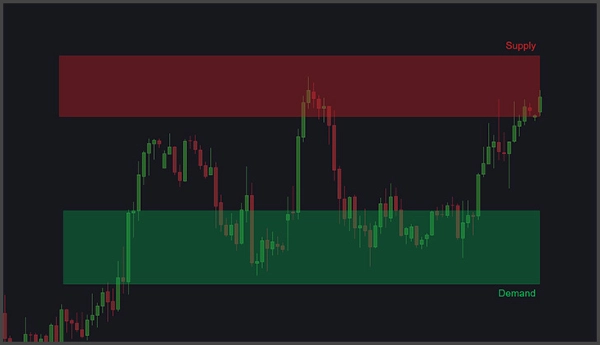
- 長方形(供給と需要エリア):
-
- オブジェクトコメントを使用してカスタムラベルを表示。
- 価格の相互作用とティックボリュームの急増に対するアラート。
- ティックボリューム急増アラートのパラメータ設定(遡及バー数、ボリューム増加率、アラート後の休止期間を含む)。
- アクティブキャンドルへの自動長方形塗りつぶしと延長。
- 全体的なカスタマイズ:
-
- 各オブジェクトタイプのラベル位置とテキストサイズを調整。
- 自動色のカスタマイズ。
- アラートメッセージにオブジェクトコメントを含める。
- 各オブジェクトタイプのアラートを有効または無効にする。
- アラートとヘルプ:
-
- 音声、ポップアップ、Telegram、メールでアラートを受信。
- チャートのスクリーンショットを自動的にTelegramに送信。
- チャート上の小さなボタンからユーザーガイドにアクセス可能。
このツールは、サポートとレジスタンス、供給と需要、フィボナッチ、またはトレンドラインを戦略に利用するトレーダーに最適です。
概要
AIによる概要
VegaXLR - Analysis Tools Alerts is an all-in-one indicator for the cTrader platform that enhances chart analysis by integrating alerts, labels, and automatic color-coding with various drawing tools. It supports trendlines, horizontal and vertical lines, Fibonacci retracement and expansion levels, and rectangles representing supply and demand areas.
Key features include:
- Trendlines: Custom labels from object comments, dynamic color changes based on direction, options to remove or extend trendlines after alerts, and toggle alerts per trendline.
- Horizontal and Vertical Lines: Custom labels, automatic deletion after alerts, and configurable alerts per line type.
- Fibonacci Levels: Custom labels, infinite extension of level lines, color assignment by drawing direction, and alert enable/disable options.
- Rectangles (Supply and Demand): Custom labels, alerts for price interactions and tick volume spikes with adjustable parameters, automatic fill and extension to the active candle.
- Overall customization allows adjustment of label positions, text sizes, automatic colors, inclusion of comments in alerts, and enabling/disabling alerts per object type.
- Alerts can be received via sound, pop-ups, Telegram, and email, with automatic chart screenshots sent to Telegram.
- A user guide is accessible directly on the chart.
This tool is suited for traders employing support and resistance, supply and demand, Fibonacci, or trendline strategies.
インジケーターのプロフィール
インジケーターのカテゴリー
サポート&レジスタンス
出力の種類
ビジュアル表示
データ要件
バーのみ
サポート対象のシグナル
クロス
ブレイクアウト
ラインタッチ
ラインブレイク
反転
トレンドの強さ
カスタマーレビュー
4.5
レビュー: 2
5 | 50 % | |
4 | 50 % | |
3 | 0 % | |
2 | 0 % | |
1 | 0 % |
ディスカッション
よくあるご質問
Fibonacci
Forex
Supply & Demand
Support & Resistance
cTrader Storeで入手可能な取引ボット、インジケーター、プラグインなどの商品は、第三者の開発者が提供するものであり、情報と技術の取得のみを目的としてご利用いただけます。cTrader Storeはブローカーではなく、投資助言や個人的な推奨を行うことも、将来のパフォーマンスを保証することもありません。
この作成者の他の商品


価格
230
販売
686
無料インストール