説明
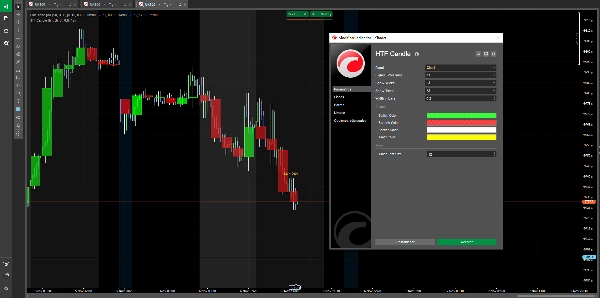
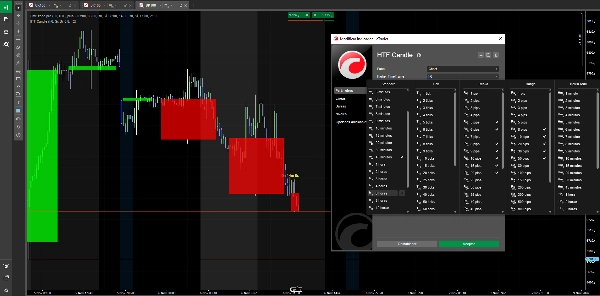
HTFキャンドル - プロのように市場を視覚化する。
プロフェッショナルな視覚的明瞭さでトレードを変革する
本当の市場トレンドを理解するために時間足を常に切り替えるのに疲れていませんか? HTFキャンドルは、現在のチャートの詳細を失うことなく複数の時間足を同時に視覚化することで、あなたに必要な優位性を提供します。
なぜHTFキャンドルが必要なのか
より賢明な判断を下すために、お気に入りの時間足でトレードしながら即座に上位時間足の構造を確認しましょう。プロのトレーダーは常に複数の時間足を分析します—今ではあなたも手間なくそれが可能です。
他の人が見逃すチャンスを見つける。 小さな時間足の市場ノイズに混乱する他のトレーダーとは異なり、あなたは本当のサポート、レジスタンス、そして支配的なトレンドがどこにあるかを完全に把握できます。
機関の流れとエントリーを同期させる。 あなたのトレード時間足が上位時間足の方向と一致するとき、成功の確率は飛躍的に高まります。
主な利点:
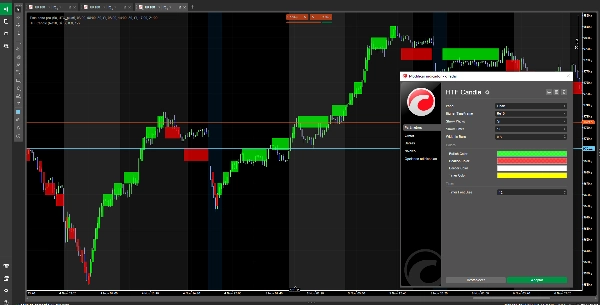
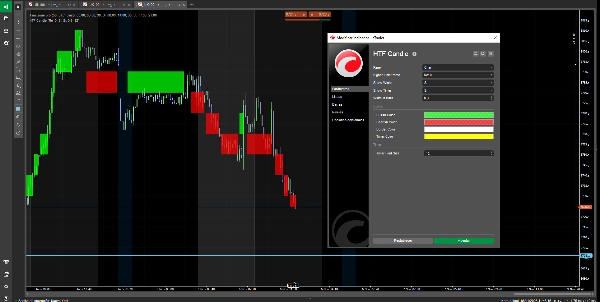
✅ リアルタイム更新 - 上位時間足のキャンドルがあなたと共に動き、市場の変化を即座に表示します
✅ スマートタイマー - 次の上位時間足のキャンドルがいつ閉じるか正確に知り、精密にトレードを計画できます
✅ 完全な互換性 - 時間ベース、ティックベース、そして使用するあらゆるチャートタイプで完璧に機能します
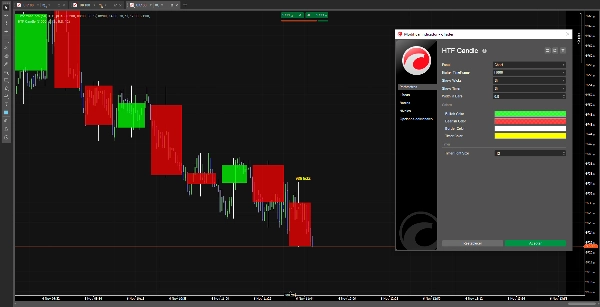
✅ 完全なカスタマイズ - 戦略や視覚的好みに合わせて色、サイズ、スタイルを調整可能です
✅ ゼロリペイント - 見たままが結果です。クローズ後の変更や驚きはありません
このインジケーターは誰のため?
- スキャルパー 信号をフィルタリングするために上位時間足のコンテキストが必要な方
- デイトレーダー エントリー前にトレンドを確認したい方
- スイングトレーダー 主要トレンドに合わせた正確なエントリーポイントを探している方
- プライスアクショントレーダー 市場構造の明確さが必要な方
マルチタイムフレームトレードの秘密、簡素化
負けるトレーダーは単一の時間足で盲目的に操作します。勝つトレーダーは市場がフラクタルであり、目の前の木だけでなく森全体を見る必要があることを理解しています。
HTFキャンドルは、あなたの生活を複雑にすることなく、その優れた視野を提供します。
もう複数のウィンドウは不要。混乱もなし。ただ明確さ、精度、そして分析の完全なコントロールだけです。
競争力への投資
トレードにおいて、適切な情報を適切なタイミングで得ることはお金です。プロのトレーダーが見るものを自信を持って見ることで意思決定する価値はどれほどでしょうか?
今すぐHTFキャンドルをダウンロードして、あなたのトレードにふさわしい視覚的優位性でトレードを始めましょう。
すべてのcTraderバージョンに対応。サポート付き。無料アップデート。
概要
Key features include a smart timer indicating when the next higher timeframe candle will close, full compatibility with time-based, tick-based, and various chart types, and extensive customization options for colors, sizes, and styles. The indicator ensures zero repainting, meaning the displayed candles do not change after closing, providing reliable visual data.
HTF Candle supports multiple markets including Forex, Indices, Commodities, and Crypto. It is suitable for scalpers, day traders, swing traders, and price action traders who require higher timeframe context to improve decision-making and align entries with broader market trends. The indicator is compatible with all cTrader versions and offers support and updates.
カスタマーレビュー
5 | 50 % | |
4 | 50 % | |
3 | 0 % | |
2 | 0 % | |
1 | 0 % |