
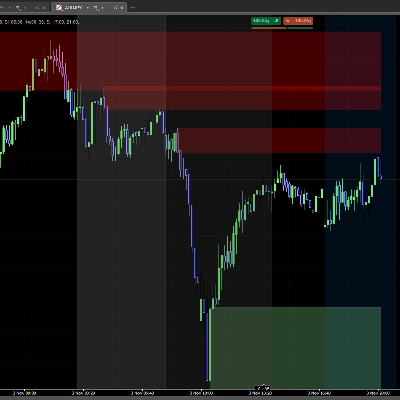
ICT Order Block
インジケーター
858 ダウンロード数
バージョン 1.0、Nov 2025
Windows、Mac
3.5
レビュー: 2

登録日 24/02/2025
18
販売
2.19K
無料インストール
説明
ICTオーダーブロック - 機関投資家のオーダーブロック
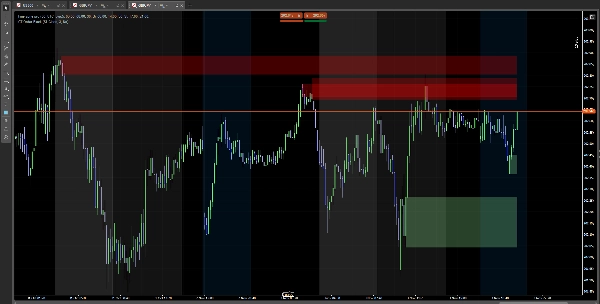
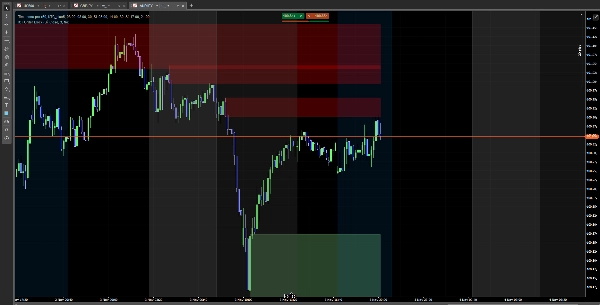
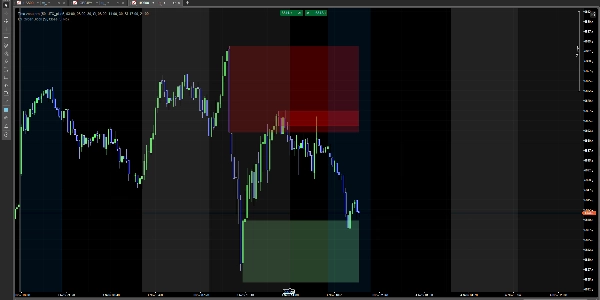
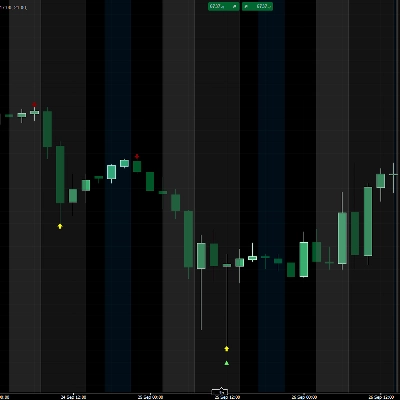
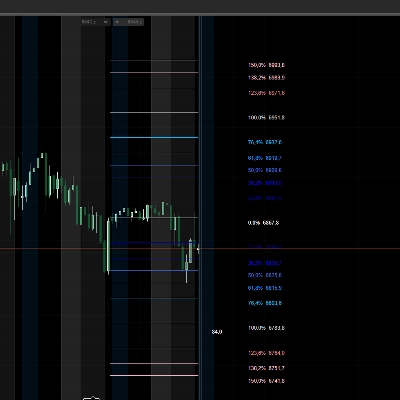
チャート上の機関投資家のオーダーブロックを自動的に識別します。価格が反応する可能性のある重要なゾーンを視覚化します。
機能
✅ 強気ブロック(機関買いゾーン)を検出 ✅ 弱気ブロック(機関売りゾーン)を検出 ✅ 重要なゾーンに色付きの長方形を表示 ✅ 価格が突破するとブロックが消える
使い方
簡単なインストール
- インジケーターをダウンロード
- cTraderのチャートに追加
- 完了!自動的にブロックが表示されます
設定
メイン設定
- SCOBを表示: ブロックの表示・非表示
- ミティゲーション方法:
-
- クローズ: ローソク足の終値でブロックが消える
- ウィック: ブロックが触れられた時に消える
- 最後のX個のSCOBを表示: 表示するブロックの数(1〜15)
- ボラティリティフィルターを適用: ボラティリティに基づいてブロックをフィルター
色設定
- 強気の色: 強気ブロックの色(デフォルトはライトグリーン)
- 弱気の色: 弱気ブロックの色(デフォルトは赤)
- カラーピッカーで透明度を調整
解釈
🟢 緑のブロック(強気): 潜在的なサポートゾーン 🔴 赤のブロック(弱気): 潜在的なレジスタンスゾーン
注意: これはテクニカル分析のインジケーターです。適切なリスク管理と共に使用してください。
概要
AI summary
ICT Order Block is a technical analysis indicator designed for use on cTrader charts. It automatically identifies institutional order blocks, highlighting key price zones where market reactions may occur. The indicator detects bullish order blocks (potential institutional buying zones) and bearish order blocks (potential institutional selling zones), displaying them as colored rectangles—green for bullish support areas and red for bearish resistance areas. These blocks visually represent important supply and demand zones that traders can monitor.
Key features include automatic block detection, configurable display options such as the number of blocks shown (1–15), and a volatility filter to refine block selection. Users can choose how blocks disappear: either when a candle closes beyond the block or when the block is touched by price wicks. Color customization and transparency adjustments are also available for better chart integration.
Installation involves adding the indicator to a cTrader chart, after which the blocks appear automatically. This tool supports analysis across Forex, Indices, and Cryptocurrency markets. It serves as a visual aid for identifying potential support and resistance zones based on institutional trading activity and should be used alongside proper risk management practices.
Key features include automatic block detection, configurable display options such as the number of blocks shown (1–15), and a volatility filter to refine block selection. Users can choose how blocks disappear: either when a candle closes beyond the block or when the block is touched by price wicks. Color customization and transparency adjustments are also available for better chart integration.
Installation involves adding the indicator to a cTrader chart, after which the blocks appear automatically. This tool supports analysis across Forex, Indices, and Cryptocurrency markets. It serves as a visual aid for identifying potential support and resistance zones based on institutional trading activity and should be used alongside proper risk management practices.
インジケーターのプロフィール
カスタマーレビュー
3.5
レビュー: 2
5 | 50 % | |
4 | 0 % | |
3 | 0 % | |
2 | 50 % | |
1 | 0 % |
カスタマーレビュー
January 27, 2026
the zones are blocking the candles, zones need to be behind the candles .other than that it is good
ディスカッション
よくあるご質問
Forex
Indices
Crypto
cTrader Storeで入手可能な取引ボット、インジケーター、プラグインなどの商品は、第三者の開発者が提供するものであり、情報と技術の取得のみを目的としてご利用いただけます。cTrader Storeはブローカーではなく、投資助言や個人的な推奨を行うことも、将来のパフォーマンスを保証することもありません。
























価格
登録日 24/02/2025
18
販売
2.19K
無料インストール