

Easy Trade
Indicator
Version 1.0, Oct 2026
Windows, Mac
4.4
Reviews: 5

Since 24/02/2025
18
Sales
2.24K
Free installs
Description
Easy Trade: Trend & Breakout Indicator for cTrader
Easy Trade reads market structure and shows you the state of the trend directly on your chart, with no clutter.
What it does
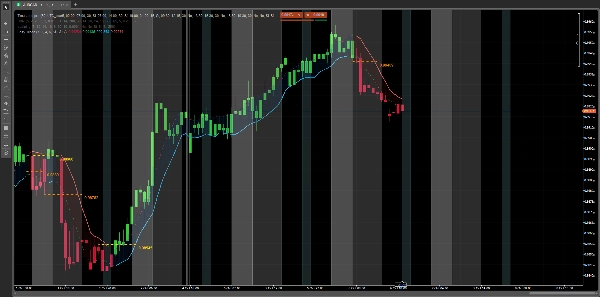
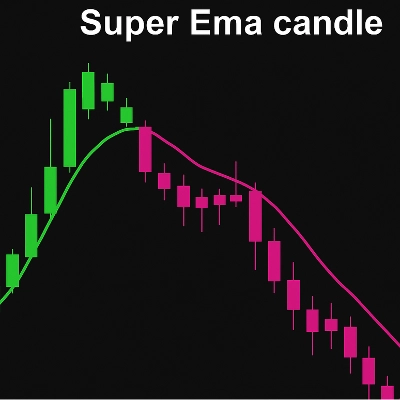
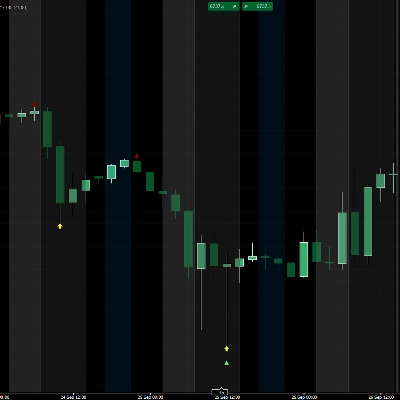
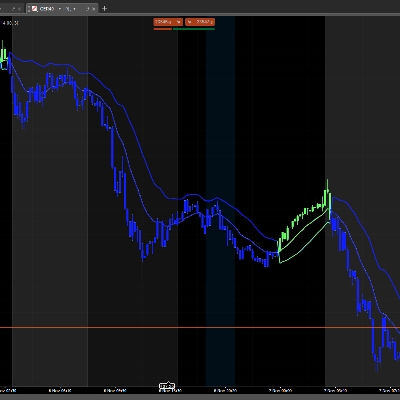
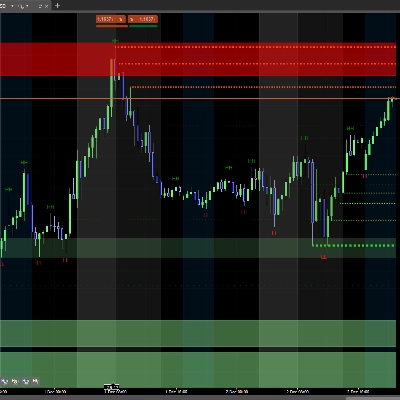
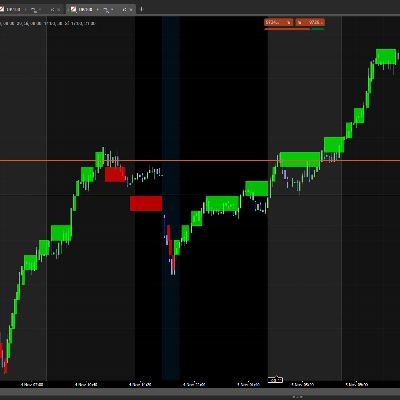
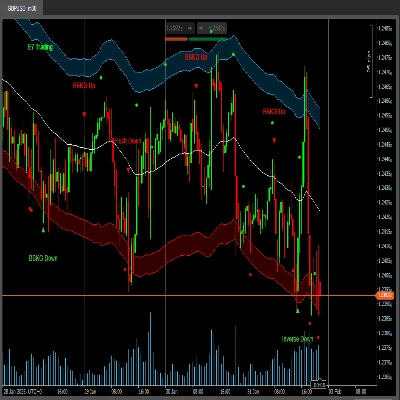
- Colored candles: the real chart candles change color when the signal changes: bullish, bearish or neutral. Nothing is drawn on top of them.
- Breakout levels: when a new trend starts, it marks the key entry level with a line and its price. The line extends for the number of candles you choose after the breakout.
- Trend zones: it plots the active trend leg and can shade the zone with a fill.
- Clean and fast: it is light, works as an overlay and does not slow down your platform.
Fully customizable
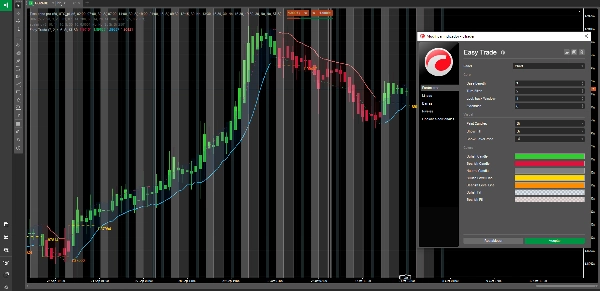
- Pick the color of every element with the native cTrader color selector: bullish, bearish and neutral candles, level lines and zone fills (with adjustable transparency).
- Turn the candle painting, the fill and the level price on or off.
- Adjust the sensitivity, the turn filter, the look-back window and the line extension to fit your style.
Works on
- Any symbol and any timeframe: Forex, indices, metals, crypto.
- Ideal for trend following, breakout trading and visual confirmation.
Risk warning: this indicator is an analysis tool, not financial advice. Past performance does not guarantee future results. Always use proper risk management.
© tradingpro.0
Summary
AI summary
Easy Trade is a trend and breakout indicator designed for the cTrader platform. It analyzes market structure and visually represents the current trend state directly on the price chart without adding clutter. Key features include:
- Colored candles that change hue to indicate bullish, bearish, or neutral market conditions by altering the actual chart candles.
- Breakout levels marked by lines and price labels at the start of new trends, with customizable line extension duration.
- Trend zones that highlight active trend legs with optional shaded fills.
- Lightweight overlay design ensuring fast performance without slowing down the platform.
The indicator is fully customizable, allowing users to select colors for bullish, bearish, and neutral candles, level lines, and zone fills with adjustable transparency. Users can enable or disable candle coloring, zone fills, and breakout price labels. Sensitivity, turn filters, look-back windows, and line extensions can be adjusted to match individual trading styles.
Easy Trade supports all symbols and timeframes, including Forex, indices, metals, and cryptocurrencies. It is suitable for trend following, breakout trading, and visual trend confirmation. The indicator provides signals such as cross, breakout, trend strength, and level breaks based on tick and bar data.
Indicator profile
Indicator category
Trend
Output type
Signals
Data requirements
Tick data
Bars only
Supported signals
Cross
Breakout
Trend strength
Level break
Discussion
Customer reviews
4.4
Reviews: 5
5 | 40 % | |
4 | 60 % | |
3 | 0 % | |
2 | 0 % | |
1 | 0 % |
Customer reviews
October 18, 2026
Colouring the candles keeps the trend state directly on price. Breakout labels and optional shaded legs add context without another pane. Sensitivity and turn filters change which moves qualify, so the cleaner view or faster response is an analytical setting rather than just a colour preference.
October 16, 2026
The faster response versus cleaner view choice is exposed through sensitivity and turn filters. That gives the candle colouring a clear analytical basis. A fairly focused trend display, with optional shaded legs adding context and no order execution implied by the chart state.
October 16, 2026
Easy Trade provides clear trend-state visualization through colored candles, directional lines, filled zones and breakout levels. Testing on EURUSD and XAUUSD across H1 and M1 showed consistent rendering and good visual alignment between price structure, trend direction and marked levels.
October 11, 2026
candle colours, breakout labels and shaded legs make the trend reading visually direct. The sensitivity controls give some choice over responsiveness. A useful overlay, with the important distinction that changing those filters alters recognised turns rather than merely repainting the same information.
October 10, 2026
Coloured candles, optional shaded legs and breakout labels make a really cohesive trend view, with sensitivity and turn filters controlling the interpretation rather than merely changing the paint.
FAQ
Supertrend
Moving Average
Products available through cTrader Store, including trading bots, indicators and plugins, are provided by third-party developers and made available for informational and technical access purposes only. cTrader Store is not a broker and does not provide investment advice, personal recommendations or any guarantee of future performance.









Price
Since 24/02/2025
18
Sales
2.24K
Free installs