
ADX and ADI
Indicator
258 downloads
Version 1.0, Aug 2025
Windows, Mac
5.0
Reviews: 2
Description
Key Features:
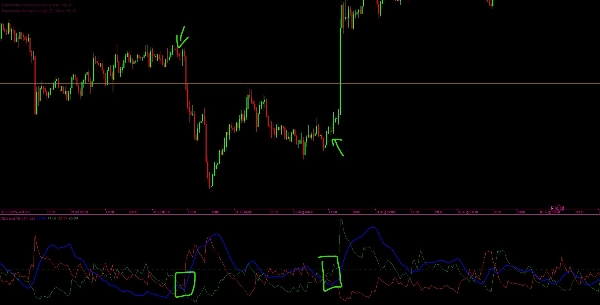
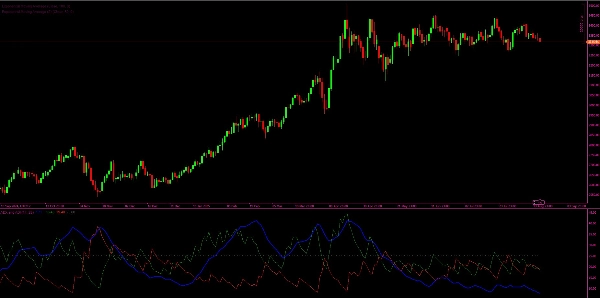
- ADX and ADI Line (Blue): Shows the smoothed strength of the current trend, regardless of direction.
- +DI Line (Green): Indicates the strength of upward movements.
- -DI Line (Red): Indicates the strength of downward movements.
- Threshold Line (Gray): A horizontal reference level (default 25) to help identify whether the trend strength is significant.
How It Works:
- The indicator calculates True Range (TR), Positive Directional Movement (+DM), and Negative Directional Movement (-DM).
- It applies Wilder’s smoothing technique to compute the smoothed values of TR, +DM, and -DM.
- From these, the Directional Indicators (+DI and -DI) are derived, showing which side (bullish or bearish) has stronger momentum.
- The DX (Directional Index) is calculated from the relative difference between +DI and -DI.
- Finally, the ADX (Average Directional Index) is computed as a smoothed version of DX, providing a measure of overall trend strength.
Interpretation:
- When ADX is above the threshold (e.g., 25), the market is considered to be trending strongly.
- When +DI > -DI, bulls are in control (uptrend).
- When -DI > +DI, bears are in control (downtrend).
- When ADX is below the threshold, the market is considered to be ranging (weak or no trend).
Summary
AI summary
This custom indicator provides a full implementation of the Average Directional Index (ADX) and Directional Indicators (DI) to measure trend strength and direction in financial markets. It displays four key lines: the ADX and ADI line (blue) representing smoothed trend strength regardless of direction; the +DI line (green) indicating upward movement strength; the -DI line (red) indicating downward movement strength; and a threshold line (gray, default 25) to identify significant trend strength.
The indicator calculates True Range (TR), Positive Directional Movement (+DM), and Negative Directional Movement (-DM), applying Wilder’s smoothing technique to derive smoothed values. From these, it computes the +DI and -DI lines to show bullish or bearish momentum. The Directional Index (DX) is calculated from the relative difference between +DI and -DI, and the ADX is a smoothed version of DX, quantifying overall trend strength.
Interpretation guidelines include: ADX above the threshold signals a strong trend; +DI greater than -DI indicates bullish control; -DI greater than +DI indicates bearish control; and ADX below the threshold suggests a ranging or weak trend market.
Indicator profile
Customer reviews
5.0
Reviews: 2
5 | 100 % | |
4 | 0 % | |
3 | 0 % | |
2 | 0 % | |
1 | 0 % |
Customer reviews
December 1, 2025
ADX and ADI delivers clean trend strength and direction signals. ADX shows when the market is actually trending, while +DI and -DI reveal who’s in control. Stable, lightweight and reliable across all timeframes. Best on H1+ for smoother signals. Alerts and zone-highlighting would be great additions.
September 12, 2025
Discussion
FAQ
Products available through cTrader Store, including trading bots, indicators and plugins, are provided by third-party developers and made available for informational and technical access purposes only. cTrader Store is not a broker and does not provide investment advice, personal recommendations or any guarantee of future performance.


Price
Since 21/02/2025
466.3M
Traded volume
180.83K
Pips won
22
Sales
6.89K
Free installs