
Rsi + Volume
Indicator
707 downloads
Version 1.0, Mar 2025
Windows, Mac
5.0
Reviews: 3
Description
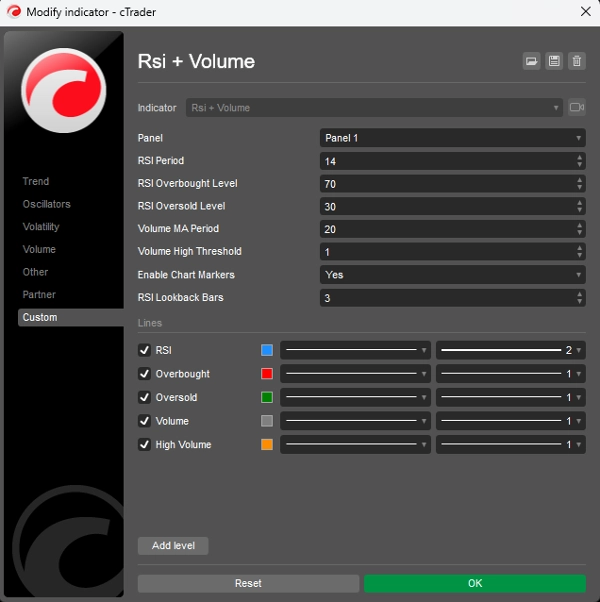
This indicator combines RSI (Relative Strength Index) with volume analysis to generate more reliable trading signals. It works on the principle that significant price movements should be accompanied by high volume to confirm the strength of the move.
Key Components:
- RSI Analysis:
- Measures the speed and change of price movements on a scale of 0-100
- Identifies overbought conditions (above 70) and oversold conditions (below 30)
- Helps spot potential reversal points in the market
- Volume Analysis:
- Compares current volume to a moving average of recent volume
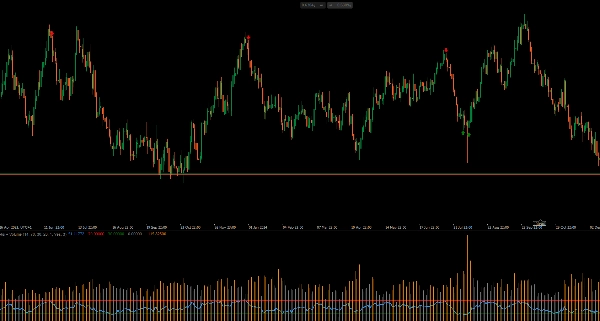
- Highlights periods of high volume (orange histogram bars)
- Confirms strength behind price movements
- Signal Generation:
- Buy Signal: When RSI crosses above the oversold level (30) with high volume
- Sell Signal: When RSI crosses below the overbought level (70) with high volume
- Visual signals appear directly on the chart (green up arrows for buy, red down arrows for sell)
How to Use It:
- Look for buy signals when price is in a downtrend and RSI shows oversold conditions
- Look for sell signals when price is in an uptrend and RSI shows overbought conditions
- Higher volume confirms the strength of the signal
- Adjust the parameters (RSI period, volume threshold) to match your trading timeframe
This indicator helps filter out false signals by requiring both RSI confirmation and above-average volume, making it more reliable than using RSI alone.
Summary
AI summary
The "Rsi + Volume" indicator integrates the Relative Strength Index (RSI) with volume analysis to enhance the reliability of trading signals. It operates on the principle that significant price movements should be confirmed by high trading volume.
Key components include:
1. RSI Analysis:
- Measures the speed and change of price movements on a 0-100 scale.
- Identifies overbought conditions (above 70) and oversold conditions (below 30).
- Helps detect potential market reversal points.
2. Volume Analysis:
- Compares current volume against a moving average of recent volume.
- Highlights periods of high volume using orange histogram bars.
- Confirms the strength behind price movements.
Signal generation occurs when RSI crosses key thresholds with accompanying high volume:
- Buy signals trigger when RSI rises above the oversold level (30) with high volume.
- Sell signals trigger when RSI falls below the overbought level (70) with high volume.
Visual signals appear directly on the chart as green up arrows for buys and red down arrows for sells.
Users can adjust parameters such as RSI period and volume threshold to fit their trading timeframe. This indicator aims to filter out false signals by requiring both RSI confirmation and above-average volume, providing more dependable trade signals than RSI alone.
Indicator profile
Customer reviews
5.0
Reviews: 3
5 | 100 % | |
4 | 0 % | |
3 | 0 % | |
2 | 0 % | |
1 | 0 % |
Customer reviews
October 12, 2025
Hello, the RSI +volume indicator is perfect, but it needed to have something: when the little arrow appears on the chart, it could show a notification or an alarm. Would you be able to add that alarm or notification in cTrader?
August 12, 2025
Pros: Combines RSI and volume for stronger trading signals. Works well when RSI threshold intersects with high volume spikes. Lightweight and clear visuals. Cons: No alerts or tooltips. Lacks template saving. May generate noise on low-volume timeframes without additional filters.
Discussion
FAQ
Signal
Indices
RSI
Products available through cTrader Store, including trading bots, indicators and plugins, are provided by third-party developers and made available for informational and technical access purposes only. cTrader Store is not a broker and does not provide investment advice, personal recommendations or any guarantee of future performance.


Price
Since 21/02/2025
466.3M
Traded volume
180.83K
Pips won
22
Sales
6.89K
Free installs