
E7 BlackScholes Model
Gösterge
252 i̇ndirmeler
Sürüm 1.0, Feb 2025
Windows, Mac
5.0
Değerlendirmeler: 1
Açıklama
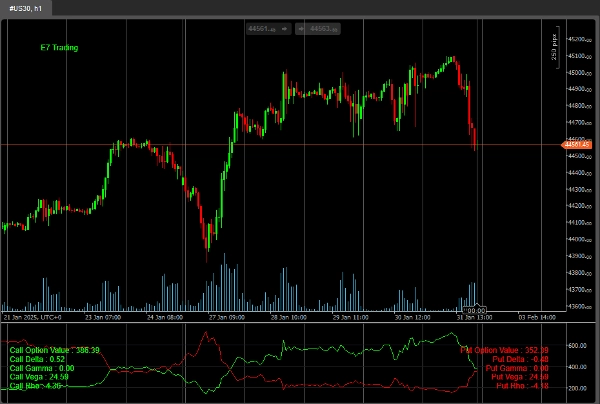
Bu, BlackScholes modeli kullanarak Opsiyon fiyatlamasını hesaplamak için cTrader içinde ‘Math.Numerics’ paketinin kullanımına dair çok basit bir örnektir.
Gelecek sürümler daha gelişmiş uygulamalar içerecektir.
Şimdilik sadece endeksler için kullanılmalıdır, teşekkürler.
İyi avlar!
Özet
YZ özeti
E7 BlackScholes Model is an indicator designed for use within the cTrader platform that calculates option pricing based on the Black-Scholes model. It utilizes the Math.Numerics package to perform these calculations. Currently, the tool is intended primarily for indices such as NASDAQ, S&P 500, DAX, and Dow. The product offers a straightforward implementation of the Black-Scholes formula, with plans for more advanced versions in the future. This indicator assists traders in evaluating option prices on index markets by providing mathematical option valuation directly integrated into their trading environment.
Gösterge profili
Müşteri değerlendirmeleri
5.0
Değerlendirmeler: 1
5 | 100 % | |
4 | 0 % | |
3 | 0 % | |
2 | 0 % | |
1 | 0 % |
Müşteri değerlendirmeleri
August 18, 2025
Pros: Calculates Black–Scholes theoretical option price and Greeks (Delta, Gamma, Theta, Vega) in real‑time. Lightweight and intuitive interface. Great for risk management and option analysis. Cons: No alerts or tooltips. Lacks template saving and real‑price comparison. Assumes constant volatility
Tartışma
SSS
Indices
cTrader Store üzerinden erişilebilen işlem botları, göstergeler ve eklentiler gibi ürünler, üçüncü taraf sağlayıcılar tarafından sağlanır ve yalnızca bilgilendirme ve teknik erişim amaçlarıyla sunulur. cTrader Store bir broker değildir ve yatırım tavsiyesi, kişisel öneriler vermez veya gelecekteki performansı garanti etmez.
Bu oluşturanın diğer ürünleri


Fiyat
Başlangıç 18/12/2024
2
Satışlar
4.24K
Ücretsiz yüklemeler