
WaveWeisBarForce
インジケーター
169 ダウンロード数
バージョン 1.0、Dec 2025
Windows、Mac
5.0
レビュー: 2
説明
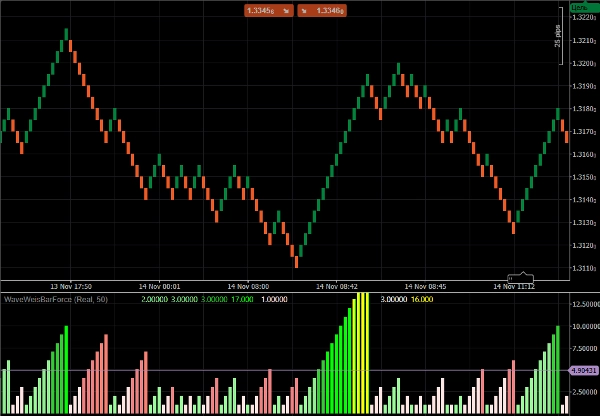
Wave Weis Bar Force - は、ボリュームウェーブ(Weis)のロジックを適用して蓄積と市場方向の変化を判断するインジケーターです。
トレンドが変わらない間、ボリュームを集計します。方向が変わると新しい波が始まり、蓄積はリセットされます。
強度は、現在の波のボリュームと最近の最大蓄積との比率に基づいてレベルで計算されます。追加のフィルターとして機能し、トレンド戦略でよく機能します。
概要
AIによる概要
Wave Weis Bar Force is a technical indicator that applies the concept of Volume Waves (Weis) to identify market accumulation phases and detect changes in market direction. It aggregates volume data while the current trend persists, resetting accumulation when a new wave begins with a trend reversal. The indicator calculates intensity levels based on the ratio of the current wave's volume to the largest recent accumulation, providing a quantitative measure of volume strength. This functionality serves as an additional filter and is particularly useful in trending market strategies. The indicator supports analysis across multiple markets including Forex, Crypto, and Stocks, and is applicable to trading approaches such as breakout and scalping strategies.
インジケーターのプロフィール
カスタマーレビュー
5.0
レビュー: 2
5 | 100 % | |
4 | 0 % | |
3 | 0 % | |
2 | 0 % | |
1 | 0 % |
カスタマーレビュー
December 10, 2025
WaveWeisBarForce blends Weis Wave logic with bar-strength analysis to show real buying/selling force. Clean histogram, stable performance, great for confirming impulses and spotting exhaustion. Useful for Wyckoff, VSA and intraday momentum traders.
ディスカッション
よくあるご質問
Forex
Breakout
Scalping
Crypto
Stocks
cTrader Storeで入手可能な取引ボット、インジケーター、プラグインなどの商品は、第三者の開発者が提供するものであり、情報と技術の取得のみを目的としてご利用いただけます。cTrader Storeはブローカーではなく、投資助言や個人的な推奨を行うことも、将来のパフォーマンスを保証することもありません。
この作成者の他の商品


価格
登録日 24/10/2025
1.43M
取引数量
4.79K
獲得pips
2
販売
317
無料インストール