Descripción
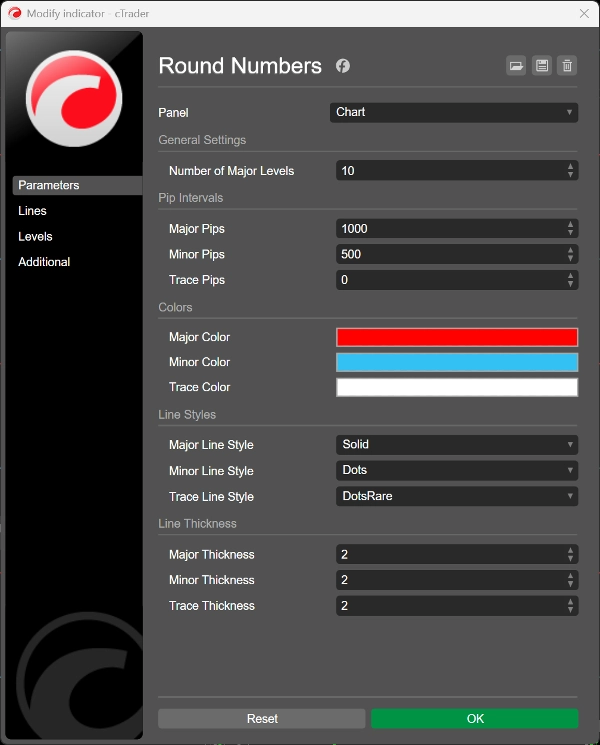
Indicador de Soportes y Resistencias en Números Redondos
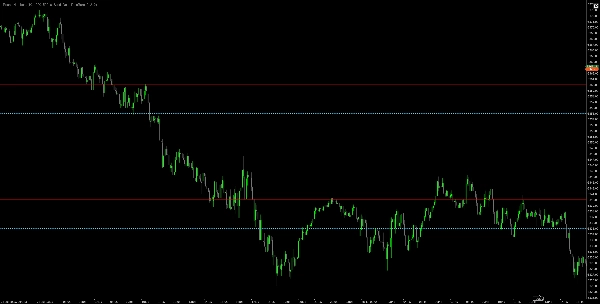
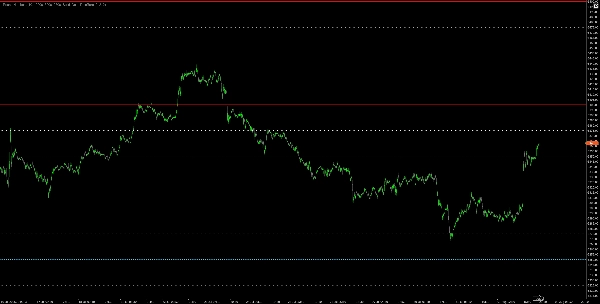
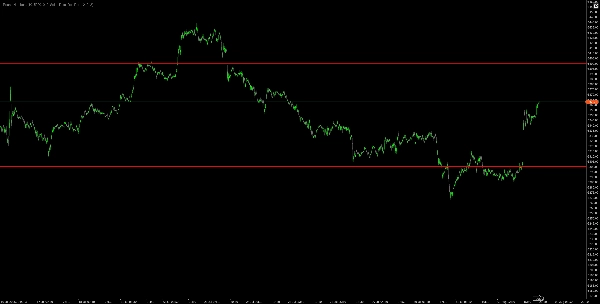
Este potente indicador traza automáticamente líneas horizontales de soporte y resistencia en niveles psicológicamente importantes de números redondos en tu gráfico. Como sabe cualquier trader experimentado, los precios tienden a reaccionar fuertemente en números redondos como 1.2000, 1.2100, 1.2050 porque estos niveles representan barreras psicológicas donde los traders colocan órdenes.
Qué hace en términos simples: 📊 Dibuja tres tipos de líneas basadas en intervalos de pips que elijas:
- Niveles mayores (líneas rojas y sólidas) - Los niveles psicológicos más fuertes (típicamente cada 100 pips)
- Niveles menores (líneas azules y punteadas) - Niveles secundarios (típicamente cada 50 pips)
- Niveles de trazo (puntos blancos y dispersos) - Niveles más finos (típicamente cada 25 pips)
Características clave:
✅ Intervalos de pips totalmente personalizables para cada tipo de nivel
✅ Elige tus propios colores y estilos de línea para una visibilidad perfecta en el gráfico
✅ Se actualiza automáticamente conforme el precio se mueve para mostrar siempre niveles relevantes
✅ Apariencia limpia y profesional que no saturará tus gráficos
✅ Funciona en todos los marcos temporales y pares de divisas
✅ Pon 0 para ocultar niveles no deseados
Resumen
Key features include full customization of pip intervals, colors, and line styles for each level type, ensuring clear chart visibility. The indicator updates dynamically as prices move to maintain relevant support and resistance lines. It is designed to provide a clean, professional appearance without cluttering charts and is compatible with all timeframes and currency pairs. Users can disable any level type by setting its interval to zero.
This tool supports multiple markets including Forex, indices, commodities, cryptocurrencies, and stocks, making it versatile for various trading strategies that rely on psychological price barriers.
Valoraciones de clientes
5 | 67 % | |
4 | 0 % | |
3 | 0 % | |
2 | 33 % | |
1 | 0 % |