
Support Resistance Zones
Indikator
1.81K unduhan
Versi 1.0, Apr 2025
Windows, Mac
5.0
Ulasan: 4
Deskripsi
Ringkasan
Ringkasan AI
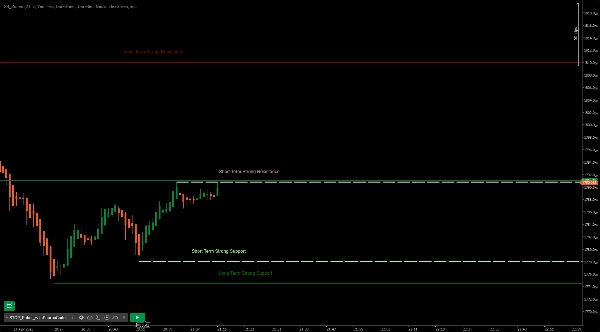
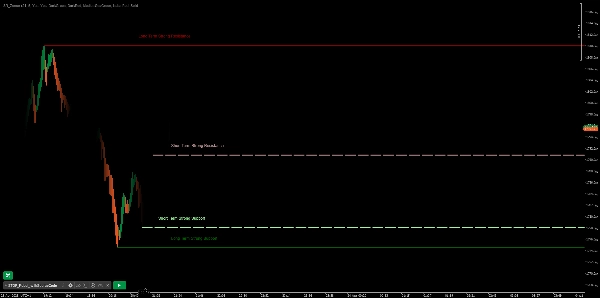
Support Resistance Zones is a trading indicator designed to identify key support and resistance levels on price charts. It distinguishes between short and long support/resistance zones and categorizes them as strong or minor resistance areas. This tool helps traders visualize critical price levels where market reversals or consolidations may occur, aiding in technical analysis and decision-making.
Profil indikator
Ulasan pelanggan
5.0
Ulasan: 4
5 | 100 % | |
4 | 0 % | |
3 | 0 % | |
2 | 0 % | |
1 | 0 % |
Ulasan pelanggan
December 21, 2025
December 18, 2025
100% Amazing tool for a beginner like me who makes 90% Wins and 90% Losses, Now just Wins and losses because I get bored - Thank YOU so much for this tool.
July 14, 2025
Pros: Automatically detects support and resistance zones. Customizable and visually clear. Works across all timeframes. Cons: No alerts or tooltips. Lacks volume-based filtering and template saving. Needs confirmation tools for reliable signals.
Diskusi
Pertanyaan umum
Produk-produk yang tersedia melalui cTrader Store, termasuk bot trading, indikator, dan plugin, disediakan oleh pengembang pihak ketiga serta hanya ditujukan untuk akses teknis dan informasi. cTrader Store bukan broker dan tidak menyediakan saran investasi, rekomendasi pribadi, atau jaminan apa pun tentang kinerja di masa mendatang.


Harga
Sejak 09/01/2025
11.78K
Instal gratis