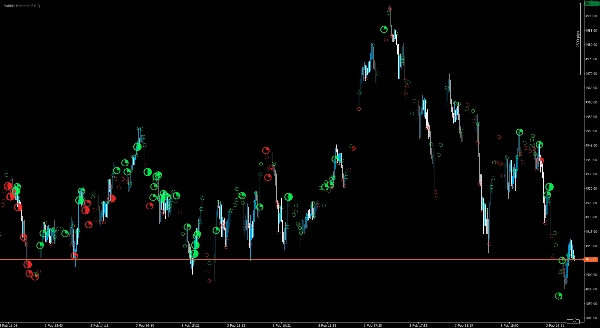
「Bubble Indicator 2.0」ロゴ
Bubble Indicator 2.0
インジケーター
6 購入済
バージョン 1.0、Feb 2026
Windows、Mac
「Bubble Indicator 2.0」アップロード画像
登録日 10/01/2026
6
販売
トライアルバージョンについて
- Test it 2 Days

Delta Peak Bubbles is built for traders who want a fast, visual way to identify “where the market is doing the work” on tick charts. Instead of cluttering your screen with extra panels, it draws clear, graded bubbles directly on the chart to reveal high‑intensity bursts of activity in real time.

The indicator focuses on peak moments within each bar and visualizes them with an easy‑to-read strength scale (from subtle circles up to a standout star for the strongest events). Bubbles are color‑coded for quick directional context, making it simple to distinguish bullish vs. bearish pressure at a glance.

Designed for practical trading workflows, Delta Peak Bubbles works especially well for:

  • Scalping and short‑term momentum trading
  • Breakout confirmation and impulse tracking
  • Identifying reaction zones and potential exhaustion points
  • Adding a “heat layer” to Price Action / SMC / key level strategies

Bubble strength guide

Bubbles are graded into four strength levels to help you quickly separate normal activity from high‑impact spikes:

  • Level 1 – Low:  (minor spike)
  • Level 2 – Medium:  (moderate spike)
  • Level 3 – High:  (strong spike)
  • Level 4 – Extreme:  (very strong / standout spike)

Color indicates directional pressure (green = bullish, red = bearish).

Display controls make it clean on any layout, including 4K monitors, so you can keep your chart readable while still seeing the important moments.

Disclaimer: Trading/Investing involves substantial risk and may result in the loss of all invested capital. This indicator is provided for informational and analytical purposes only and does not constitute financial advice, an offer, or a recommendation. Use is at your own risk; you remain solely responsible for all trading decisions and outcomes. The provider makes no representations or warranties (express or implied) regarding accuracy, completeness, timeliness, performance, merchantability, or fitness for a particular purpose. To the fullest extent permitted by law, the provider shall not be liable for any direct or indirect losses, damages, or lost profits arising from or related to the use of this indicator (including, without limitation, losses due to market conditions, data/platform issues, configuration errors, or misuse). Past performance is not a reliable indicator of future results.

トライアルバージョンについて
- Test it 2 Days
インジケーターのプロファイル
0.0
レビュー: 0
カスタマーレビュー
この商品にはまだレビューがありません。お使いになったことがある方は、ぜひレビューをお願いします。
Breakout
Scalping
SMC
cTrader Storeで入手可能な取引ボット、インジケーター、プラグインなどの商品は、第三者の開発者が専ら情報提供および技術的な参考目的で提供するものです。cTrader Storeはブローカーではなく、投資助言や個人的な推奨を行わず、将来のパフォーマンスを保証しません。

これも好きかも

インジケーター
📊Market Structure, Swing Levels, Order Blocks & Liquidity Zones (2Tops/2Bottoms). Smart Money approach. 🚀"*
インジケーター
Prop
Forex
+11
Performance Panel von BullMoon Finance: Analysiere Deine cTrader-Historie visuell direkt im Chart!
インジケーター
HMA MTF Hull Moving AverageMulti Timeframe
インジケーター
Prop
Forex
+12
Enhance trading with TSI! Use the True Strength Index for clear insights into market momentum and trend strength.
インジケーター
Forex
NAS100
+3
volumen perfile
インジケーター
Prop
Forex
+6
Stochastic Confluence Pro (RSI + Divergence)
インジケーター
ATR
BOS
+5
Smart SMC + Fibonacci engine with ATR filtering, dynamic levels, and precision entry signals.
インジケーター
Forex
Crypto
+2
A powerful cTrader indicator with customizable Moving Average alerts, notifications, and automated trading actions.
インジケーター
AI
ATR
+26
Liquidity Cluster Order automatically detects and draws accumulation zones & distribution zones
インジケーター
this indicaotr show distance between Tenkan to Kijun, Close to Kijun and Close to Tenkan 
インジケーター
Grid
Prop
+18
Volumen Delta", es una representación visual del flujo de órdenes basada en el volumen de transacciones.
インジケーター
Forex
Crypto
+3
Igor Levshin's Balance of Power measuring buyer vs seller strength for momentum and divergence analysis.
インジケーター
Prop
Forex
+9
Automatically plots fractal high and low lines on your chart so you always have clean, reliable structure levels.
インジケーター
Forex
BTCUSD
+6
🚀 VQTX Indicator - The Ultimate Volatility & Trend Analysis Tool 🚀
インジケーター
TraderMax BB Filter X (DEMO) for cTrader 🧪 Limited-Time Demo Version (24h) TraderMax BB Filter X (DEMO) is a precision
インジケーター
Signal
Bollinger
BB20 MULTICOLOR
インジケーター
AI
RSI
+7
EMA MTF TREND PRO - Multi-timeframe trend analysis overlay indicator, 6 timeframes - in one table with ADX
インジケーター
SMC
Prop
+14
Right-anchored cTrader Volume Profile with VAH/VAL/POC, LVZ, top volume+EMA, themes, and fast, readable visuals.
登録日 10/01/2026
6
販売