
説明
🎯 マルチタイムフレームボラティリティインテリジェンス
ボラティリティのブレイクアウトを見逃さない - すべてのタイムフレームを同時に確認
ほとんどのボラティリティ指標は一つの視点しか示しません。私たちの マルチタイムフレームローリングボラティリティ指標 は短期(7)、中期(21)、長期(63)の期間にわたる完全な全体像を提供し、 組み込みのトレーディングシグナル で正確な行動タイミングを教えます。
⚡ なぜマルチタイムフレームボラティリティがすべてを変えるのか
単一タイムフレーム vs 私たちのマルチタイムフレームアプローチ:
- ❌ 単一期間: 木は見えるが森を見逃す
- ✅ 三期間: 文脈を持った完全なボラティリティの全景
実際のトレーディングシナリオ:
- 短期の急騰 長期は穏やか → 一時的なノイズ(無視)
- すべてのタイムフレームが上昇 → 本物のレジームチェンジ(行動)
- 短期は穏やか 長期は混乱 → 偽の穏やかさ(注意)
🎯 プロフェッショナル機能
✨ トリプルタイムフレームの可視化
- StdDev 7: 即時のボラティリティ変化を捉える(イントラデイ)
- StdDev 21: 中期のボラティリティ(スイングトレード)
- StdDev 63: 長期のボラティリティ文脈(ポジショントレード)
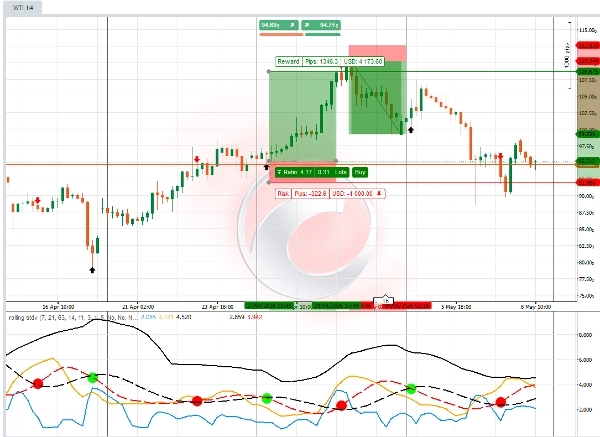
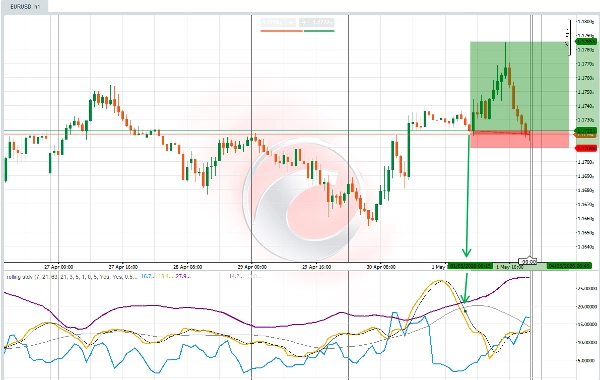
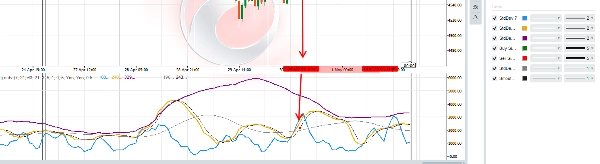
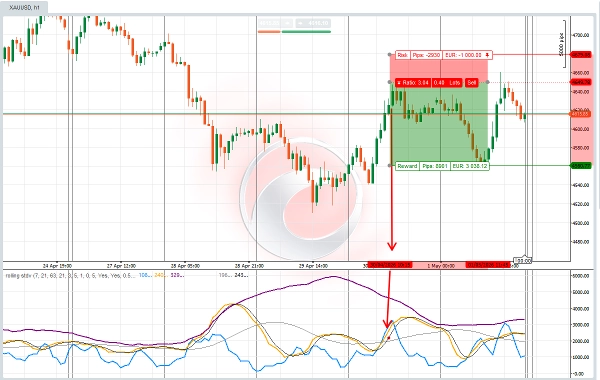
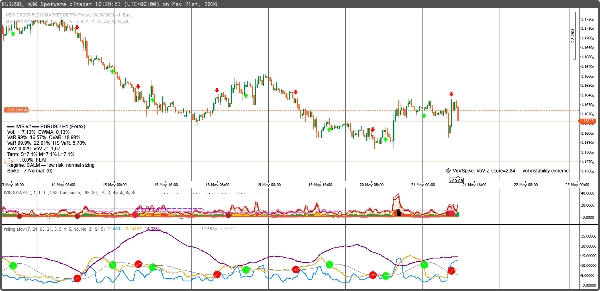
- オシレーターシグナル: 平均 ローリング標準偏差のシグナルラインが交差すると、色付きのドットが高低のボラティリティと価格動向を確認します。大きな赤ドット、緑ドットのシグナルが出ると、トレーダーはチャート上で赤矢印、緑矢印のシグナルも確認でき、エントリーレベルや取引サイズの判断に役立ちます。
- ローリング標準偏差は予測的な市場シグナルロジックを持つボラティリティオシレーターです。パネル上のパラメータはトレーダーが取引したいCFD商品タイプに合わせて確認・調整する必要があります。すべての金融資産CFD商品はパネル設定が若干異なる場合があります。トレーダーはスロープ、速/中間クロスシグナル、スムージングを有効にしてボラティリティ読み取りの精度と正確さを選択できます。
📊 高度なボラティリティ分析
- ボラティリティクロスオーバー: StdDevラインの交差 = レジームチェンジ
- 平均回帰シグナル: ボラティリティが平均に戻る
- スパイク検出: 極端なボラティリティイベント
💡 これらのトレーディングスタイルに最適:
🎯 ボラティリティブレイクアウトトレーダー
- 爆発的な動きの前の低ボラティリティ時にエントリー
- 反転前の高ボラティリティ時にエグジット
- トリプル確認で正確にエントリータイミングを計る
📈 平均回帰トレーダー
- ボラティリティの極端な動きを自信を持って逆張り
- 過剰に伸びた市場状況を特定
- ボラティリティを逆張り指標として利用
🛡 リスク回避トレーダー
- 高ボラティリティ期間を完全に回避
- 穏やかで予測可能な市場のみで取引
- ボラティリティを ポジションサイズのガイドとして使用
📊 オプショントレーダー
- 高ボラティリティ時のプレミアム売り
- ボラティリティ圧縮時のオプション購入
- IVとHVの分析による誤価格検出
組み込みスマートシグナル:
- ✅ 買いシグナル: ボラティリティが閾値を下回るか移動平均を下回ったとき
- ✅ 売りシグナル: ボラティリティが閾値を上回るか移動平均を上回ったとき
📈 あなたが得るもの:
✅ トリプルタイムフレームの可視化 - ボラティリティの文脈を推測する必要なし
✅ 自動買い/売りシグナル - 最適ポイントでの明確な視覚的矢印
✅ ボラティリティレジーム検出 - 市場が穏やかか混沌としているかを把握
✅ カスタマイズ可能な閾値 - どんなトレーディングスタイルや資産にも適応可能
✅ プロフェッショナルな色分け - 即座に視覚的理解が可能
💰 特別ローンチ価格:$50
(通常価格:$100)
価値の内訳:
- StdDev 7 指標: $29の価値
- StdDev 21 指標: $29の価値
- StdDev 63 指標: $29の価値
- トレーディングシグナル: $49の価値
- 合計価値: $136
- あなたの価格: $50(35%割引)
含まれるもの: フルインジケーター カラー
🎁 ボーナス:無料ボラティリティタイミングガイド
購入には 「マルチタイムフレームボラティリティマスタリー」 - $39相当が無料で含まれます。
内容:
- ボラティリティ圧縮トレーディング戦略
- マルチタイムフレーム確認技術
- ボラティリティの高い期間のリスク管理
- 実際のトレード例
🚀 ボラティリティタイミングをマスターする準備はできましたか?
「カートに追加」をクリックして、市場のボラティリティの見方と取引方法を変えましょう。
「私はあらゆるボラティリティ指標を試しました。このトリプルタイムフレームアプローチと組み込みシグナルは、私がプロップファームのトレードで毎日使っているものです。」
- サラ・ロドリゲス、プロフェッショナルスイングトレーダー
これらの市場に最適:
📊 株式&ETF
- SPY、QQQのボラティリティタイミング
- ボラティリティに基づくセクター回転
- 決算ボラティリティプレイ
💹 外国為替ペア
- 主要ペアのボラティリティ分析
- キャリートレードのリスク評価
- ブレイクアウトの確認
📈 コモディティ
- 金のボラティリティサイクル
- 石油のボラティリティスパイク
- 農産物の季節的ボラティリティ
🔄 暗号通貨
- BTC/ETHのボラティリティレジーム
- アルトコインのボラティリティ機会
- 暗号通貨のリスク管理
まとめ: これは単なる標準偏差指標ではありません。市場が動こうとしている正確なタイミングを示す完全なボラティリティタイミングシステムです。
限定ローンチオファー: 最初の150コピーは$89($30割引)
「アマチュアとプロのトレーディングの違いはしばしばボラティリティタイミングにあります。この指標はそのギャップを埋めます。」
今すぐカートに追加 → プロのようにボラティリティを取引し始めましょう。
概要
Key features include:
- Triple timeframe visibility for immediate, swing, and position trading contexts.
- Volatility crossovers signaling regime shifts.
- Mean reversion and spike detection for volatility extremes.
- Customizable parameters to adapt to different CFD instruments and trading styles.
- Professional color-coded signals for quick interpretation.
This indicator suits various trading styles, including volatility breakout, mean reversion, risk-averse, and options trading. It supports multiple markets such as stocks, ETFs, forex pairs, commodities, and cryptocurrencies, providing volatility timing insights for assets like SPY, QQQ, gold, oil, BTC, and ETH.
Included with the indicator is a volatility timing guide covering compression strategies, multi-timeframe confirmation, risk management, and real trade examples. The tool requires tick data and outputs actionable signals to enhance volatility-based trading decisions.
カスタマーレビュー
5 | 50 % | |
4 | 50 % | |
3 | 0 % | |
2 | 0 % | |
1 | 0 % |


![「[Hamster-Coder] Pivot Points MTF」ロゴ](https://cdn.ctrader.com/image/webp/4c143e5a-309c-40e3-a578-f04d1e133ffa_31159)


![「Smart Money Concepts (SMC) [Iridio Capital]」ロゴ](https://cdn.ctrader.com/image/webp/28b69fd1-ef54-4bed-9487-07e78e883be4_40934)


