
E7 Correlation Dashboard
インジケーター
421 ダウンロード数
バージョン 1.0、Jan 2025
Windows、Mac
5.0
レビュー: 1

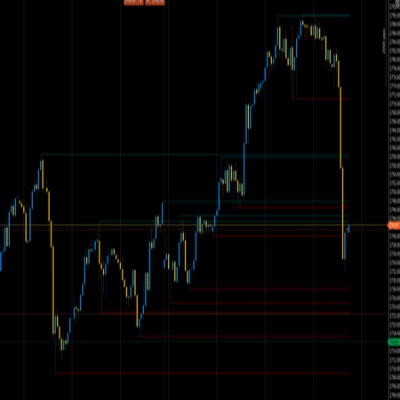
説明
ただのシンプルな相関ダッシュボードです。
将来のバージョンでは、より多くの機能が含まれる予定です。
ハッピー・ハンティング!
概要
AIによる概要
E7 Correlation Dashboard is a straightforward indicator designed to display correlation data within a trading platform. It provides users with a simple interface to monitor and analyze correlations between financial instruments. The product is focused on delivering core correlation insights, with plans for expanded functionality in future updates.
インジケーターのプロフィール
カスタマーレビュー
5.0
レビュー: 1
5 | 100 % | |
4 | 0 % | |
3 | 0 % | |
2 | 0 % | |
1 | 0 % |
カスタマーレビュー
August 12, 2025
Pros: Compact dashboard showing real-time correlation between instruments. Helps avoid overexposure to correlated assets. Cons: No alerts or historical heatmaps. Tooltip and preset saving features are missing.
ディスカッション
よくあるご質問
cTrader Storeで入手可能な取引ボット、インジケーター、プラグインなどの商品は、第三者の開発者が提供するものであり、情報と技術の取得のみを目的としてご利用いただけます。cTrader Storeはブローカーではなく、投資助言や個人的な推奨を行うことも、将来のパフォーマンスを保証することもありません。


価格
登録日 18/12/2024
2
販売
4.26K
無料インストール