
説明
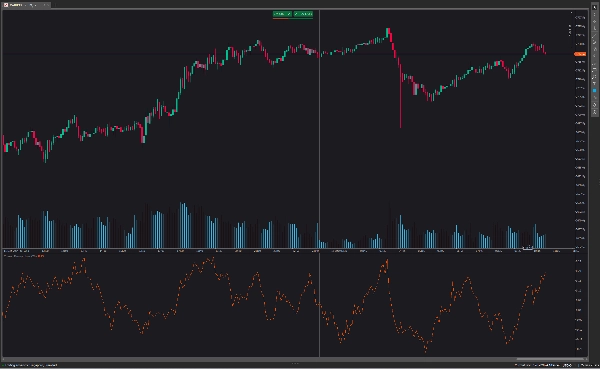
チャイキン・マネーフローの主な目的は 証券の蓄積期間と分配期間を区別することです。指標がゼロラインを上回っている場合、それは証券が純蓄積を経験していることを示し、投資家が資産を購入していることを示唆します。
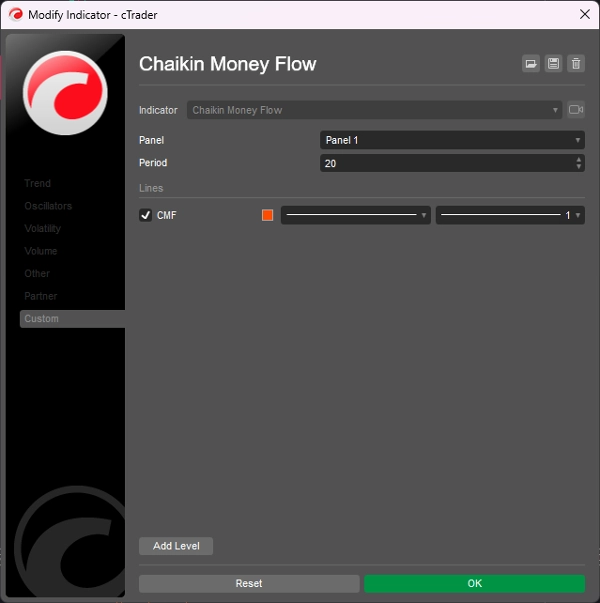
- 30を超える値のチャイキン・マネーフロー設定は指標の感度を低くします。これにより、信号は少なくなりますが、質は向上します。
- 20未満の値のチャイキン・マネーフロー設定は指標を過敏にします。これにより、市場のノイズが増加します。
- CMF指標が上からゼロラインを越えてロング/買いシグナルを生成すると、上昇トレンドが継続していることを示します。
- CMF指標が下からゼロラインを越えてショート/売りシグナルを生成すると、下降トレンドが継続していることを示します。
概要
AIによる概要
The Chaikin Money Flow (CMF) indicator is designed to identify periods of accumulation and distribution for a security. When the CMF value is above zero, it signals net accumulation, indicating buying pressure. Conversely, values below zero suggest distribution or selling pressure. The indicator’s sensitivity can be adjusted: settings above 30 reduce sensitivity, producing fewer but higher-quality signals, while settings below 20 increase sensitivity, resulting in more market noise. Key signals include a continued uptrend when the CMF crosses the zero line from above, generating buy signals, and a continued downtrend when it crosses from below, generating sell signals. This tool helps traders assess buying and selling momentum to inform trading decisions.
インジケーターのプロフィール
カスタマーレビュー
5.0
レビュー: 1
5 | 100 % | |
4 | 0 % | |
3 | 0 % | |
2 | 0 % | |
1 | 0 % |
カスタマーレビュー
August 18, 2025
Reliable volume-based trend confirmation, easy to read, customizable period. Cons: No alerts, no MTF analysis, limited filtering options.
ディスカッション
よくあるご質問
cTrader Storeで入手可能な取引ボット、インジケーター、プラグインなどの商品は、第三者の開発者が提供するものであり、情報と技術の取得のみを目的としてご利用いただけます。cTrader Storeはブローカーではなく、投資助言や個人的な推奨を行うことも、将来のパフォーマンスを保証することもありません。


価格
2
販売
6.9K
無料インストール