
KDJ
Indicateur
255 téléchargements
Version 1.0, Dec 2024
Windows, Mac
5.0
Avis : 1
Description
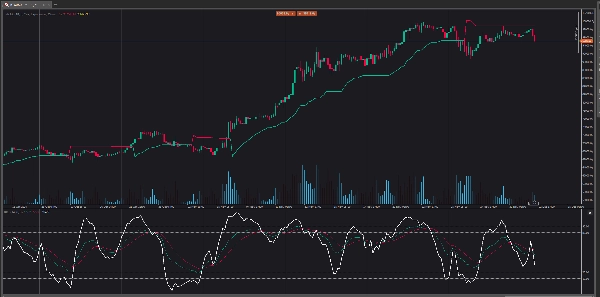
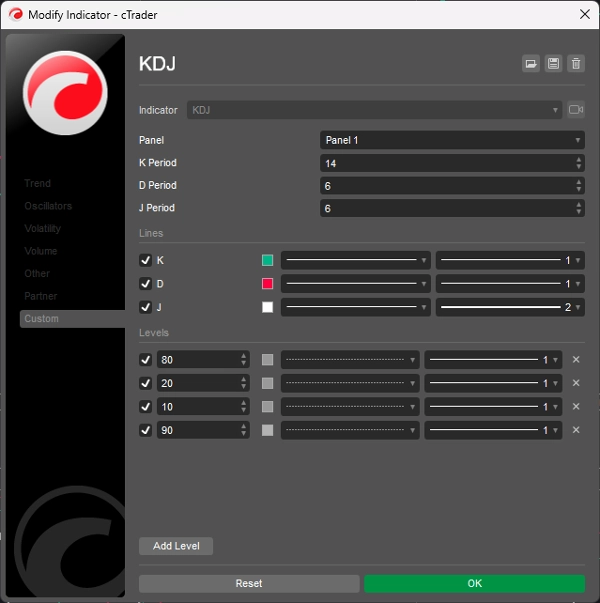
L'affichage de l'oscillateur KDJ se compose de 3 lignes (K, D et J - d'où le nom de l'affichage) et de 2 niveaux. K et D sont les mêmes lignes que celles utilisées dans l'oscillateur stochastique. La ligne J représente la déviation de la valeur D par rapport à la valeur K. La convergence de ces lignes indique de nouvelles opportunités de trading. Comme pour l'oscillateur stochastique, les niveaux de survente et de surachat correspondent aux moments où la tendance est susceptible de s'inverser.
Résumé
Résumé IA
The KDJ indicator is an oscillator consisting of three lines: K, D, and J, along with two reference levels. The K and D lines correspond to those used in the stochastic oscillator, while the J line measures the deviation of the D value from the K value. This convergence of the three lines is used to identify potential new trading opportunities. Similar to the stochastic oscillator, the KDJ indicator highlights overbought and oversold conditions, which often signal possible trend reversals. This tool is designed to assist traders in timing entries and exits by analyzing momentum and trend strength through these oscillating lines.
Profil de l'indicateur
Avis clients
5.0
Avis : 1
5 | 100 % | |
4 | 0 % | |
3 | 0 % | |
2 | 0 % | |
1 | 0 % |
Avis clients
August 18, 2025
Pros: Three-line stochastic oscillator (K, D, J) that identifies overbought/oversold levels and momentum shifts. Supports divergence analysis and crossovers between K and D as trading signals. Lightweight and responsive. Cons: No alerts, tooltips, or settings presets. J‑line can generate outlier v
Discussion
Questions fréquentes
Les produits disponibles sur cTrader Store, notamment les bots de trading, les indicateurs et les plug-ins, sont fournis par des développeurs tiers et mis à disposition à titre informatif et à des fins d'accès technique uniquement. cTrader Store n'est pas un courtier et ne fournit aucun conseil en investissement, aucune recommandation personnelle ni aucune garantie quant aux performances futures.
Plus de cet auteur


Prix
2
Ventes
6.9K
Installations gratuites