
dark-cloud
Wskaźnik
185 pobrania
Wersja 1.0, Mar 2025
Windows, Mac
Opis
Wskaźnik Dark Cloud Cover to narzędzie analizy technicznej zaprojektowane do identyfikacji potencjalnych wzorców odwrócenia trendu spadkowego na rynku. Wzorzec ten składa się z dwóch kolejnych świec:
- Byczej (zielonej) świecy sygnalizującej silny impet kupna.
- Niedźwiedziej (czerwonej) świecy otwierającej się powyżej poprzedniego zamknięcia, ale zamykającej się poniżej połowy poprzedniej świecy, co wskazuje na presję sprzedaży.
Ta formacja sugeruje potencjalną zmianę nastrojów na rynku, gdzie kupujący tracą kontrolę, a sprzedający przejmują inicjatywę.
Cechy i funkcjonalność:
- Wykrywanie wzorców:
-
- Wskaźnik skanuje w poszukiwaniu wzorca Dark Cloud Cover na podstawie akcji cenowej świec.
- Po wykryciu wizualnie podkreśla wzorzec, aby ostrzec traderów.
- Filtr trendu (opcjonalny):
-
- Aby poprawić dokładność, wskaźnik zawiera opcjonalny filtr trendu wykorzystujący Średnią Kroczącą (MA).
- Jeśli jest włączony, wzorzec jest uznawany za ważny tylko wtedy, gdy występuje w trendzie wzrostowym.
- Logika potwierdzenia:
-
- Wskaźnik może potwierdzić sygnał spadkowy, sprawdzając następną świecę.
- Świeca potwierdzająca jest identyfikowana, jeśli zamyka się poniżej Dark Cloud Cover minimum i ma wyższy wolumen ticków niż średnia z ostatnich świec.
- Zapewnia to większą wiarygodność sygnału.
- Wizualne oznaczenia:
-
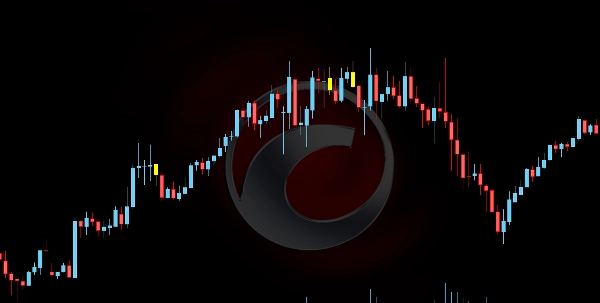
- Żółte świece: Oznaczają wykryty wzorzec Dark Cloud Cover.
- Pomarańczowe świece: Podkreślają świecę potwierdzającą, jeśli spełnione są warunki wolumenu.
Ten wskaźnik pomaga traderom dostrzegać wysokoprawdopodobne sygnały odwrócenia, poprawiając podejmowanie decyzji dotyczących krótkich pozycji lub strategii zarządzania ryzykiem.
Podsumowanie
Podsumowanie AI
The Dark Cloud Cover indicator is a technical analysis tool that identifies a specific bearish reversal candlestick pattern. This pattern consists of two candles: a bullish (green) candle indicating strong buying momentum, followed by a bearish (red) candle that opens above the previous close but closes below the midpoint of the prior candle, signaling selling pressure and a potential shift from buyers to sellers.
Key features include:
- **Pattern Detection:** Automatically scans for the Dark Cloud Cover pattern based on candlestick price action and visually highlights detected patterns for trader awareness.
- **Optional Trend Filter:** Incorporates a Moving Average (MA) filter to validate patterns only during uptrends, enhancing signal accuracy.
- **Confirmation Logic:** Validates bearish signals by analyzing the subsequent candle, which must close below the pattern’s low with higher-than-average tick volume to confirm the reversal.
- **Visual Markers:** Uses yellow candles to mark detected patterns and orange candles to highlight confirmation candles meeting volume criteria.
This indicator assists traders in recognizing high-probability bearish reversal setups, supporting decision-making for short entries and risk management strategies.
Profil wskaźnika
Opinie klientów
0.0
Opinie: 0
Opinie klientów
Ten produkt nie ma jeszcze opinii. Wypróbowałeś(-aś) go już? Bądź pierwszy(-a) i powiedz o tym innym!
Dyskusja
Częste pytania
Signal
Produkty dostępne za pośrednictwem cTrader Store, w tym boty handlowe, wskaźniki i wtyczki, dostarczane są przez deweloperów zewnętrznych i udostępniane wyłącznie w celach informacyjnych oraz w celu zapewnienia dostępu technicznego. cTrader Store nie jest brokerem i nie zapewnia doradztwa inwestycyjnego, nie udziela spersonalizowanych rekomendacji ani nie gwarantuje przyszłych wyników.
Więcej od tego autora


Cena
5
Sprzedaż
436
Bezpłatne instalacje