
설명
📌 기능 및 작동
- 볼린저 밴드 (20기간 SMA, 표준편차 2)
-
- 상단 밴드: 과매수 수준을 나타냅니다.
- 하단 밴드: 과매도 수준을 나타냅니다.
- 상대강도지수 (RSI) (14기간)
-
- RSI 70 이상 → 시장은 과매수 상태입니다 (과도한 매수 압력).
- RSI 30 이하 → 시장은 과매도 상태입니다 (과도한 매도 압력).
- 반전 구역 감지:
-
- 레드 존 (과매도):
-
- 종가가 하단 볼린저 밴드 아래에 있음.
- RSI가 30 이하임 (강한 매도 압력).
- 의미: 시장이 과매도 상태이며, 잠재적 매수 기회입니다.
- 그린 존 (과매수):
-
- 종가가 상단 볼린저 밴드 위에 있음.
- RSI가 70 이상임 (강한 매수 압력).
- 의미: 시장이 과매수 상태이며, 잠재적 매도 기회입니다.
- 시각적 차트 표시기:
-
- 과매도 시 붉은 음영 영역 (잠재적 매수 기회).
- 과매수 시 녹색 음영 영역 (잠재적 매도 기회).
- 알림 및 음성 신호:
-
- 차트에 텍스트 표시 (“깊은 과매도 신호!” 또는 “깊은 과매수 신호!”).
- 과매수/과매도 상태 감지 시 음성 알림 재생.
🎯 이 지표가 트레이더에게 어떻게 도움이 되나요?
✅ 잠재적 시장 반전 경고 신호 제공 (극단적인 가격 수준에서).
✅ 강력한 진입 및 청산 시점 찾기에 도움.
✅ 볼린저 밴드와 RSI 결합하여 신뢰할 수 있는 과매수/과매도 감지 제공.
✅ 다양한 타임프레임에서 데이 트레이딩, 스윙 트레이딩, 스캘핑에 적합.
🚀 요약:
이 지표는 과매수 및 과매도 상태를 식별하고, 가격 반전 가능성을 경고합니다. 트레이더는 이를 활용해 현명한 매수 및 매도 결정을 내릴 수 있습니다!
🚨 거래 위험 고지 🚨
주식, 외환, 암호화폐, 원자재, 파생상품 등 금융 상품 거래는 높은 위험을 수반하며 모든 투자자에게 적합하지 않습니다. 거래에 참여하기 전에 관련 위험을 이해하고 자신의 재정 상황, 경험 및 위험 감수성을 신중히 고려하는 것이 필수적입니다.
시장은 매우 변동성이 크며, 경제 지표 발표, 지정학적 사건, 시장 심리, 예상치 못한 뉴스로 인해 가격 변동이 갑작스럽고 예측 불가능할 수 있습니다. 이러한 변동성은 상당한 이익을 가져올 수 있지만, 동시에 큰 손실도 초래할 수 있습니다. 시장은 빠르게 불리한 방향으로 움직일 수 있으며, 손절매 및 위험 관리 전략이 손실 방지를 보장하지 않고, 레버리지는 이익과 손실을 모두 증폭시켜 초기 투자금을 초과하는 손실이 발생할 수 있습니다.
어떤 거래 전략, 기술 지표 또는 방법도 수익을 보장하지 않습니다. 과거 성과가 미래 결과를 보장하지 않으며, 과거 성공이 미래 이익을 보장하지 않습니다. 전문 트레이더도 손실을 경험하며, 시장 상황은 끊임없이 변하고 미래 움직임을 확실히 예측하는 것은 불가능합니다. 거래는 절대 추측이나 감정에만 의존해서는 안 됩니다.
레버리지 또는 마진 거래를 사용하면 적은 자본으로 더 큰 포지션을 통제할 수 있지만, 이는 위험을 크게 증가시킵니다. 레버리지는 자본의 급격한 손실을 초래할 수 있고, 마진 콜은 불리한 가격에 포지션 청산을 강제할 수 있으며, 마진 거래는 초기 예치금보다 더 많은 손실을 초래할 수 있습니다. 또한 유동성 위험과 슬리피지가 발생할 수 있어, 특정 시점에 매수자 또는 매도자가 부족할 수 있고, 주문이 예상 가격에 체결되지 않을 수 있습니다. 시장 갭은 갑작스러운 가격 급등을 초래하여 손절매 수준을 완전히 우회할 수 있습니다.
거래에는 규율, 인내, 감정 조절이 필요합니다. 두려움, 탐욕, 과신은 종종 잘못된 거래 결정을 초래하여 손실 가능성을 높입니다. 감정적 거래는 충동적이고 비합리적인 결정을 낳으며, 놓칠까 두려움(FOMO)과 복수 거래는 과도한 위험 감수를 초래할 수 있습니다. 명확한 전략을 개발하고 위험 관리 계획을 준수하는 것이 중요합니다.
규제 및 법적 위험도 고려해야 하며, 각 관할 구역마다 거래 및 투자에 관한 규제가 다릅니다. 일부 금융 상품은 귀하의 국가에서 이용할 수 없으며, 규제 변경은 시장 상황에 영향을 미칠 수 있습니다. 항상 현지 법률 및 금융 규정을 준수하고, 신뢰할 수 있고 규제된 중개인 또는 거래소를 이용하며, 심각한 재정 위험을 초래할 수 있는 비규제 플랫폼은 피하십시오.
기술 관련 위험도 간과해서는 안 되며, 거래는 거래 플랫폼, 인터넷 연결, 소프트웨어 실행에 크게 의존합니다. 느린 인터넷이나 서버 문제로 인한 지연 실행은 예상치 못한 손실을 초래할 수 있고, 시스템 장애는 포지션이 의도보다 오래 열려 있게 만들 수 있으며, 온라인 거래 플랫폼 사용 시 사이버 보안 위험이 존재합니다.
모든 거래 정보, 지표, 신호 또는 도구는 교육 목적으로만 제공되며 재정 조언으로 간주되어서는 안 됩니다. 트레이더는 스스로 조사하고 필요 시 면허가 있는 재정 고문과 상담한 후 투자 결정을 내려야 합니다. 어떤 지표나 전략도 일관된 수익성을 보장하지 않으며, 모든 거래 결정에 대한 책임은 전적으로 개별 트레이더에게 있습니다.
거래에서 가장 중요한 규칙은 잃어도 되는 돈으로만 거래하는 것입니다. 거래는 본질적으로 위험하며 손실이 초기 투자금을 초과할 수 있습니다. 잃을 준비가 된 여유 자금으로만 거래하고, 빌린 돈이나 필수 생활비는 절대 사용하지 말며, 모든 자금을 단일 거래나 자산에 집중하지 않고 분산 투자하십시오.
거래는 고위험 활동이며 주요 수입원으로 의존해서는 안 됩니다. 많은 트레이더가 손실을 보고, 장기적으로 수익을 내는 사람은 소수에 불과합니다. 정보에 기반한 결정을 내리고 위험을 관리하며 항상 책임감 있게 거래하십시오. 어떤 거래 플랫폼, 도구 또는 지표를 사용하든 거래와 관련된 위험을 인지하고 수용하는 것으로 간주됩니다.
책임감 있게 거래하세요. 정보를 유지하세요. 자본을 보호하세요. 🚀
요약
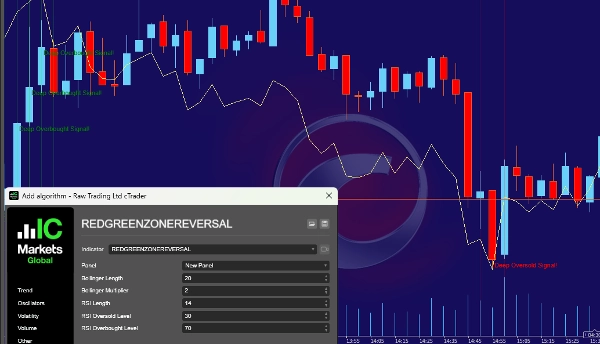
- Red Zone (Oversold): Closing price below the lower Bollinger Band and RSI below 30, signaling strong selling pressure and a potential buying opportunity.
- Green Zone (Overbought): Closing price above the upper Bollinger Band and RSI above 70, indicating strong buying pressure and a potential selling opportunity.
Visual markers include red-shaded zones for oversold conditions and green-shaded zones for overbought conditions. Alerts are provided via on-chart text notifications ("Deep Oversold Signal!" or "Deep Overbought Signal!") and sound signals when these conditions occur.
This tool assists traders by providing warning signals for potential market reversals at extreme price levels, helping to identify strong entry and exit points. It is suitable for various trading styles, including day trading, swing trading, and scalping, across different timeframes. The indicator supports markets such as forex, stocks, indices, and commodities.
고객 리뷰
5 | 100 % | |
4 | 0 % | |
3 | 0 % | |
2 | 0 % | |
1 | 0 % |


