
dark-cloud
Indicatore
182 download
Versione 1.0, Mar 2025
Windows, Mac
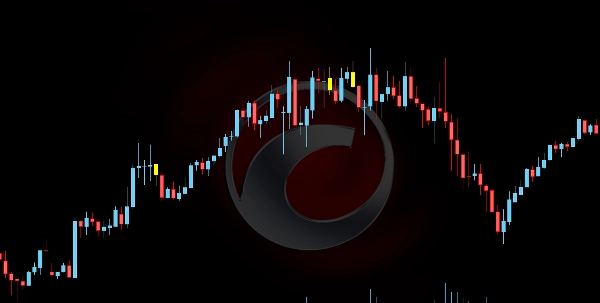
L'indicatore Dark Cloud Cover è uno strumento di analisi tecnica progettato per identificare potenziali pattern di inversione ribassista nel mercato. Questo pattern consiste in due candele consecutive:
- Una candela rialzista (verde) che segnala un forte slancio di acquisto.
- Una candela ribassista (rossa) che apre sopra la chiusura precedente ma chiude sotto la metà della candela precedente, indicando pressione di vendita.
Questa formazione suggerisce un potenziale cambiamento nel sentiment del mercato, dove gli acquirenti perdono il controllo e i venditori prendono il sopravvento.
Caratteristiche e funzionalità:
- Rilevamento del pattern:
-
- L'indicatore scansiona il pattern Dark Cloud Cover basandosi sull'azione del prezzo delle candele.
- Quando rilevato, evidenzia visivamente il pattern per avvisare i trader.
- Filtro di tendenza (opzionale):
-
- Per migliorare la precisione, l'indicatore include un filtro di tendenza opzionale utilizzando una Media Mobile (MA).
- Se abilitato, il pattern è considerato valido solo quando si verifica in una tendenza rialzista.
- Logica di conferma:
-
- L'indicatore può convalidare il segnale ribassista controllando la candela successiva.
- Una candela di conferma è identificata se chiude sotto il Dark Cloud Cover minimo e ha un volume di tick superiore alla media delle candele recenti.
- Questo garantisce una maggiore affidabilità del segnale.
- Indicatori visivi:
-
- Candele gialle: Segnano il pattern Dark Cloud Cover rilevato.
- Candele arancioni: Evidenziano la candela di conferma se le condizioni di volume sono soddisfatte.
Questo indicatore aiuta i trader a individuare configurazioni di inversione ad alta probabilità, migliorando il processo decisionale per ingressi short o strategie di gestione del rischio.
Profilo indicatore
0.0
Recensioni: 0
Recensioni dei clienti
Questo prodotto non ha ancora ricevuto recensioni. L'hai già provato? Fallo sapere agli altri per primo!
Signal
I prodotti disponibili tramite cTrader Store, inclusi bot di trading, indicatori e plugin, sono forniti da sviluppatori terzi e resi disponibili esclusivamente a scopo informativo e di accesso tecnico. cTrader Store non è un broker e non fornisce consulenze in materia di investimento, raccomandazioni individualizzate o garanzie di risultati futuri.
Altro da questo autore


5
Vendite
429
Installazioni gratuite