
Descrição
📌 Recursos e Funcionalidades
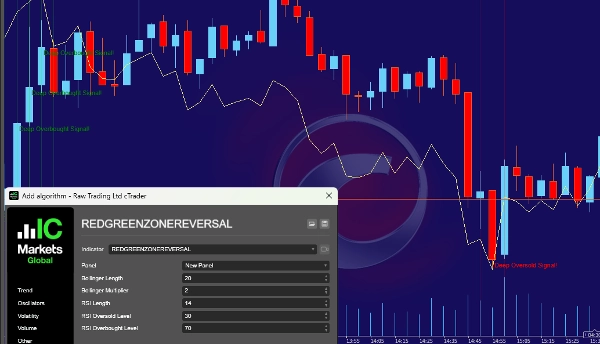
- Bandas de Bollinger (SMA de 20 períodos com desvio padrão de 2)
-
- Banda superior: Indica níveis de sobrecompra.
- Banda inferior: Indica níveis de sobrevenda.
- Índice de Força Relativa (RSI) (14 períodos)
-
- RSI acima de 70 → O mercado está sobrecomprado (pressão excessiva de compra).
- RSI abaixo de 30 → O mercado está sobrevendido (pressão excessiva de venda).
- Detecta zonas de reversão:
-
- Zona Vermelha (Sobrevendido):
-
- O preço de fechamento está abaixo da Banda de Bollinger inferior.
- RSI está abaixo de 30 (forte pressão de venda).
- Significado: O mercado está sobrevendido, uma oportunidade potencial de compra.
- Zona Verde (Sobrecomprado):
-
- O preço de fechamento está acima da Banda de Bollinger superior.
- RSI está acima de 70 (forte pressão de compra).
- Significado: O mercado está sobrecomprado, uma oportunidade potencial de venda.
- Marcadores visuais no gráfico:
-
- Zona sombreada em vermelho quando sobrevendido (oportunidade potencial de compra).
- Zona sombreada em verde quando sobrecomprado (oportunidade potencial de venda).
- Alertas e Sinais Sonoros:
-
- Texto aparece no gráfico (“Sinal de Sobrevenda Profunda!” ou “Sinal de Sobrecompra Profunda!”).
- Notificações sonoras são reproduzidas quando uma condição de sobrecompra/sobrevenda é detectada.
🎯 Como este indicador ajuda os traders?
✅ Fornece sinais de alerta para potenciais reversões de mercado (em níveis extremos de preço).
✅ Ajuda os traders a encontrar pontos fortes de entrada e saída.
✅ Combina Bandas de Bollinger e RSI para detecção confiável de sobrecompra/sobrevenda.
✅ Adequado para day trading, swing trading e scalping em diferentes intervalos de tempo.
🚀 Resumo:
Este indicador ajuda a identificar condições de sobrecompra e sobrevenda e alerta quando uma reversão de preço é provável. Os traders podem usar isso para tomar decisões inteligentes de compra e venda!
🚨 Aviso de Risco de Negociação 🚨
Negociar instrumentos financeiros, incluindo ações, forex, criptomoedas, commodities e derivativos, envolve um alto nível de risco e não é adequado para todos os investidores. Antes de se envolver em qualquer forma de negociação, é essencial entender os riscos envolvidos e considerar cuidadosamente sua situação financeira, experiência e tolerância ao risco.
Os mercados podem ser altamente voláteis, e os movimentos de preços podem ser súbitos e imprevisíveis devido a divulgações de dados econômicos, eventos geopolíticos, sentimento do mercado ou notícias inesperadas. Essa volatilidade pode resultar em ganhos substanciais, mas também em perdas significativas. Os mercados podem se mover contra sua posição rapidamente, stop-losses e estratégias de gerenciamento de risco não garantem prevenção de perdas, e a alavancagem pode amplificar tanto ganhos quanto perdas, potencialmente excedendo seu investimento inicial.
Não há garantias de que qualquer estratégia de negociação, indicador técnico ou método resultará em lucros. O desempenho histórico não garante resultados futuros, e o sucesso passado não assegura ganhos futuros. Mesmo traders profissionais experimentam perdas, as condições do mercado mudam constantemente, e prever movimentos futuros com certeza é impossível. A negociação nunca deve ser baseada apenas em especulação ou emoções.
Usar alavancagem ou negociação com margem permite controlar posições maiores com um investimento de capital menor, mas isso também aumenta significativamente o risco. A alavancagem pode levar a uma rápida perda de capital, chamadas de margem podem forçar a liquidação de posições a preços desfavoráveis, e negociar com margem pode resultar em perder mais dinheiro do que o inicialmente depositado. Além disso, riscos de liquidez e slippage podem ocorrer, significando que pode não haver compradores ou vendedores suficientes em um dado momento, e as ordens podem não ser executadas nos preços esperados. Gaps de mercado podem levar a saltos súbitos de preço, ignorando completamente os níveis de stop-loss.
Negociar requer disciplina, paciência e controle emocional. Medo, ganância e excesso de confiança frequentemente levam a decisões ruins de negociação, aumentando a probabilidade de perdas. Negociar emocionalmente pode resultar em decisões impulsivas e irracionais, enquanto o medo de perder uma oportunidade (FOMO) e a negociação por vingança podem levar a riscos excessivos. Desenvolver uma estratégia clara e seguir um plano de gerenciamento de risco é crucial.
Riscos regulatórios e legais também devem ser considerados, pois diferentes jurisdições têm regulamentações distintas sobre negociação e investimentos. Alguns produtos financeiros podem não estar disponíveis em seu país, e mudanças regulatórias podem impactar as condições do mercado. Sempre assegure conformidade com as leis locais e regulamentos financeiros, negocie com corretores ou bolsas reputados e regulamentados, e evite plataformas não regulamentadas que possam representar riscos financeiros significativos.
Riscos relacionados à tecnologia não devem ser negligenciados, pois a negociação depende fortemente de plataformas de negociação, conectividade à internet e execução de software. Execuções atrasadas devido à internet lenta ou problemas no servidor podem resultar em perdas inesperadas, falhas no sistema podem fazer com que posições permaneçam abertas por mais tempo do que o pretendido, e riscos de segurança cibernética existem ao usar plataformas de negociação online.
É importante notar que todas as informações de negociação, indicadores, sinais ou ferramentas são apenas para fins educacionais e não devem ser consideradas como aconselhamento financeiro. Os traders devem realizar suas próprias pesquisas e, se necessário, consultar um consultor financeiro licenciado antes de tomar decisões de investimento. Nenhum indicador ou estratégia garante lucratividade consistente, e a responsabilidade por todas as decisões de negociação é exclusivamente do trader individual.
A regra mais importante na negociação é nunca negociar com dinheiro que você não pode perder. A negociação é inerentemente arriscada, e as perdas podem exceder os investimentos iniciais. Negocie apenas com renda disponível que você esteja preparado para perder, nunca use dinheiro emprestado ou despesas essenciais para viver, e diversifique seus investimentos para evitar colocar todos os fundos em uma única negociação ou ativo.
Negociar é uma atividade de alto risco e não deve ser considerada como fonte principal de renda. Muitos traders perdem dinheiro, e apenas uma pequena porcentagem alcança lucratividade a longo prazo. Tome decisões informadas, gerencie riscos e sempre negocie com responsabilidade. Ao usar qualquer plataforma, ferramenta ou indicador de negociação, você reconhece e aceita os riscos associados à negociação.
Negocie com responsabilidade. Mantenha-se informado. Proteja seu capital. 🚀
Resumo
- Red Zone (Oversold): Closing price below the lower Bollinger Band and RSI below 30, signaling strong selling pressure and a potential buying opportunity.
- Green Zone (Overbought): Closing price above the upper Bollinger Band and RSI above 70, indicating strong buying pressure and a potential selling opportunity.
Visual markers include red-shaded zones for oversold conditions and green-shaded zones for overbought conditions. Alerts are provided via on-chart text notifications ("Deep Oversold Signal!" or "Deep Overbought Signal!") and sound signals when these conditions occur.
This tool assists traders by providing warning signals for potential market reversals at extreme price levels, helping to identify strong entry and exit points. It is suitable for various trading styles, including day trading, swing trading, and scalping, across different timeframes. The indicator supports markets such as forex, stocks, indices, and commodities.
Avaliações de clientes
5 | 100 % | |
4 | 0 % | |
3 | 0 % | |
2 | 0 % | |
1 | 0 % |


