


Description
⚠️Mise à jour profitez d'informations vraiment approfondies⚠️
🔥 TABLEAU DE BORD DE LA CARTE DE CHALEUR 📈
Un terminal de flux d'ordres et de momentum de qualité institutionnelle pour cTrader.
Le Tableau de bord de la carte de chaleur n'est pas simplement une superposition de graphique basique — c'est un écosystème de trading en trois parties intégré directement dans votre plateforme. Il vous offre une vision "rayons X" de la liquidité du marché, des moyennes pondérées par le volume réelles, et des tendances à l'échelle macro, le tout sans ralentir votre ordinateur. ⚡
🎯 Ce qu'il fait (Le point de vue du trader)
Le système décompose votre trading en trois étapes simples :
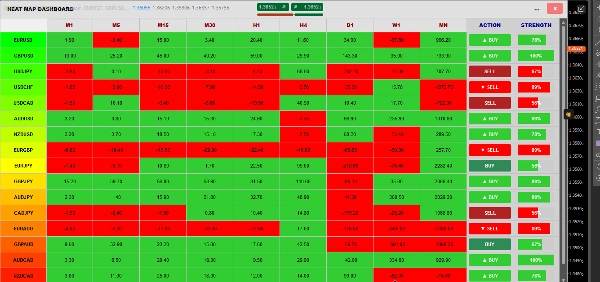
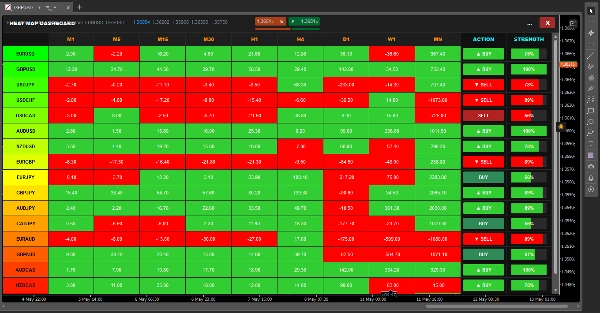
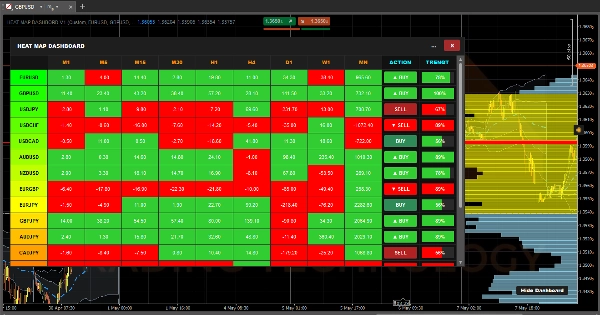
- 🎛️ Étape 1 : QUOI trader (La Matrice). Au lieu de cliquer à travers des dizaines de graphiques, le tableau de bord analyse 17 actifs différents sur 9 périodes (M1 à Mensuel). Il calcule le momentum pour chaque cellule et le code en couleur. En un coup d'œil, vous savez exactement quelle paire est dans une tendance massive et prête à être tradée.
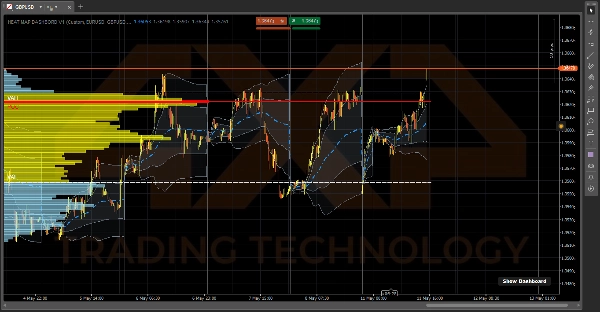
- 🌊 Étape 2 : QUI est aux commandes (Le VWAP). Une fois que vous choisissez une paire, regardez le VWAP Ancré Quotidien. Il vous montre le vrai prix moyen basé sur le volume, pas seulement les chandeliers. Les nuages d'écart-type ombragés agissent comme un support/résistance dynamique, vous montrant exactement quand le marché est fortement survendu ou suracheté.
- 📊 Étape 3 : OÙ entrer (Le VRVP). Enfin, le Profil de Volume de la Plage Visible cartographie exactement où se trouve la forte liquidité institutionnelle. Il trace automatiquement votre Point de Contrôle (POC) et les lignes de 70% Zone de Valeur (VAH & VAL), vous fournissant des niveaux d'une précision extrême pour exécuter vos entrées et sorties.
⚙️ Comment ça marche (Sous le capot)
La plupart des indicateurs qui essaient de faire autant de calculs figeraient instantanément votre plateforme et feraient planter cTrader avec une utilisation CPU à 100%. Pour éviter cela, le Tableau de bord de la carte de chaleur est alimenté par trois moteurs indépendants hautement optimisés fonctionnant simultanément :
1. Le moteur du tableau de bord (Le battement de cœur de 2 secondes) ⏱️ Si nous calculions 153 combinaisons (17 paires x 9 périodes) à chaque tick de prix, votre ordinateur fondrait. À la place, ce moteur fonctionne sur un minuteur strict de 2 secondes. Toutes les 2 secondes, il regarde silencieusement le prix d'il y a 14 chandelles, le compare au prix actuel, et colore la cellule en vert (momentum positif) ou rouge (momentum négatif).
2. Le moteur VRVP (Le lecteur d'écran) 🖥️ Au lieu de charger des milliers de barres de données historiques, le Profil de Volume agit comme un "écouteur de vue" dynamique. Il ne s'active que lorsque vous zoomez ou faites défiler physiquement votre graphique. Il demande à cTrader quelles chandelles sont actuellement visibles à l'écran, calcule le chevauchement exact du volume pour ces barres spécifiques, et redessine instantanément la zone de valeur à 70%.
3. Le moteur VWAP (L'accumulateur de ticks) 🧮 Le VWAP est la seule chose qui calcule sur le tick en direct. Cependant, pour rester ultra-rapide, il utilise une "série de données cumulatives" légère. Au lieu de recalculer toute la journée chaque seconde, il ajoute simplement le volume du nouveau tick à un total de fond en cours, et s'efface automatiquement à la milliseconde exacte où l'horloge sonne minuit.
4. Le gestionnaire de fenêtres (Le métamorphe) 🪟 Le tableau de bord est enveloppé dans une logique de dimensionnement C# personnalisée qui écoute activement votre moniteur. Lorsque vous cliquez sur les boutons Maximiser [ ] ou Restaurer [=], l'indicateur lit dynamiquement votre Chart.Width et Chart.Height en temps réel, changeant instantanément de forme pour s'adapter parfaitement à votre écran sans s'effondrer !
Résumé
1. Market Momentum Matrix: Scans 17 assets across 9 timeframes (from 1 minute to monthly), calculating and color-coding momentum to identify trending pairs quickly.
2. Daily Anchored Volume Weighted Average Price (VWAP): Displays true average prices weighted by volume, with dynamic standard deviation clouds indicating overbought or oversold conditions.
3. Visible Range Volume Profile (VRVP): Maps institutional liquidity by highlighting the Point of Control (POC) and 70% Value Area (VAH & VAL) within the visible chart range, aiding precise entry and exit levels.
The dashboard operates via four optimized engines: a 2-second heartbeat engine for momentum updates, a viewport-driven VRVP engine for volume profile recalculations, a tick-accumulating VWAP engine for real-time volume-weighted pricing, and a dynamic window manager that adjusts the interface to fit the chart size. This architecture ensures efficient performance and real-time responsiveness. The indicator supports visualization, signals (including trend strength, breakouts, and reversals), and filtering based on tick data, volume, and market structure analysis. It is tagged for aggressive trading, market structure, liquidity sweeps, support/resistance, and risk dashboard functionalities.
Avis clients
5 | 67 % | |
4 | 33 % | |
3 | 0 % | |
2 | 0 % | |
1 | 0 % |
Discussion
Questions fréquentes
Plus de cet auteur









![Logo de "[Hamster-Coder] Pivot Points MTF"](https://cdn.ctrader.com/image/webp/4c143e5a-309c-40e3-a578-f04d1e133ffa_31159)
















Prix