
Penerangan
https://chartshots.spotware.com/c/695be69b1a3ca
https://chartshots.spotware.com/c/695be2a98e848
https://chartshots.spotware.com/c/695be7e8e88fa
https://chartshots.spotware.com/c/695be31346fe7
https://chartshots.spotware.com/c/695be3bd18aea
https://chartshots.spotware.com/c/695be5d5687c7
Corak Carta Auto
📊 APA ITU?
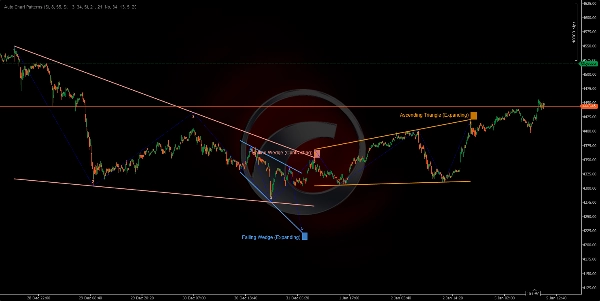
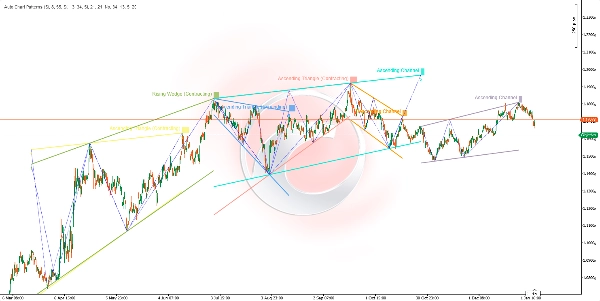
Penunjuk Corak Carta Auto adalah pengimbas formasi geometri canggih yang secara automatik mengesan dan memvisualisasikan corak carta klasik menggunakan analisis titik ayunan berbilang jangka masa. Ia mengenal pasti 14 formasi geometri berbeza termasuk saluran, baji, dan segitiga dengan menghubungkan titik ayunan tinggi dan rendah dengan garis tren, mewujudkan sistem pengenalan corak yang komprehensif.
🎯 APA GUNA NYA?
Penunjuk ini membantu pedagang untuk:
- Mengesan secara automatik 14 corak carta klasik (saluran, baji, segitiga) 📐
- Mengenal pasti zon pecahan potensi sebelum ia berlaku ⚡
- Memvisualisasikan struktur pasaran melalui hubungan harga geometri 🔍
- Berdagang corak sambungan dan pembalikan dengan pengesahan visual ✅
- Menapis corak mengikut arah tren dan jenis pivot akhir 🎛️
- Menganalisis berbilang jangka masa ayunan serentak untuk kesesuaian 🌊
🔍 BAGAIMANA IA BERFUNGSI?
Sistem Pengesanan Titik Ayunan 📍
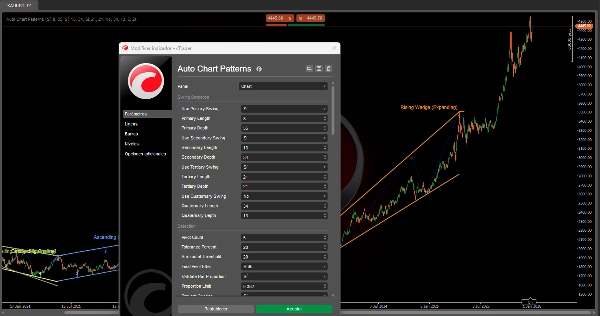
Penunjuk menggunakan sehingga empat pengesan ayunan bebas yang berjalan serentak, setiap satu dengan kepekaan yang boleh dikonfigurasikan:
- Logik Pengesanan:
-
- Memantau harga tinggi dan rendah dalam tetingkap bergulir (Tempoh).
- Mengenal pasti puncak tempatan (ayunan tinggi) dan lembah (ayunan rendah).
- Mengesahkan ayunan hanya selepas keperluan kedalaman minimum dipenuhi (mengelakkan bunyi).
- Ayunan Tinggi: Harga mencapai tinggi tertinggi dalam Tempoh, kemudian jatuh selama
MinDepthbar. - Ayunan Rendah: Harga mencapai rendah terendah dalam Tempoh, kemudian naik selama
MinDepthbar.
- Empat Lapisan Ayunan:
-
- Ayunan Utama (Lalai: Panjang 8, Kedalaman 55) - Struktur jangka panjang 🔵
- Ayunan Sekunder (Lalai: Panjang 13, Kedalaman 34) - Struktur jangka sederhana 🟢
- Ayunan Tersier (Lalai: Panjang 21, Kedalaman 21) - Struktur jangka pendek 🟡
- Ayunan Kuaternari (Lalai: Dinonaktifkan) - Jangka masa tersuai 🟣
Setiap pengesan boleh diaktifkan/dinonaktifkan secara bebas untuk menumpukan pada struktur pasaran tertentu.
Proses Pembentukan Corak 🎨
LANGKAH 1 - PENGUMPULAN PIVOT:
- Sistem mengumpul 5 atau 6 titik ayunan terkini daripada mana-mana pengesan aktif.
- Titik mesti bergantian antara tinggi dan rendah (struktur zigzag).
- Contoh 5-titik: Tinggi → Rendah → Tinggi → Rendah → Tinggi.
LANGKAH 2 - PEMBINAAN GARIS TREND:
- Memisahkan pivot kepada titik atas (ayunan tinggi) dan titik bawah (ayunan rendah).
- Melukis dua garis tren: sempadan atas dan sempadan bawah.
- Untuk sempadan 3-titik: Menguji 3 gabungan (0-2, 0-1, 1-2) dan memilih yang paling sesuai ⭐
- Mengesahkan bahawa garis tren tidak menembusi badan lilin (hanya sumbu dibenarkan).
- Mengira skor kesesuaian: garis mesti menyentuh < 20% bar antara pivot.
LANGKAH 3 - ANALISIS GEOMETRI:
- Mengukur hubungan sudut antara sempadan atas dan bawah.
- Menentukan sama ada formasi itu Melebar (melebar), Mengecut (menyempit), atau Selari (lebar tetap).
- Mengenal pasti arah tren: Naik, Turun, atau Neutral (mendatar).
- Mengklasifikasikan kepada salah satu daripada 14 jenis formasi berdasarkan geometri.
LANGKAH 4 - PENGESAHAN & PENAPISAN:
- Pemeriksaan Nisbah Bar: Memastikan jarak ayunan adalah seimbang (mengelakkan corak terdistorsi) ✅
- Pencegahan Pertindihan: Menghalang corak baru yang bertindih dengan yang sedia ada 🚫
- Pemeriksaan Pendua: Mengelakkan melukis semula corak yang sama.
- Penapis Pivot Akhir: Hanya menunjukkan corak yang berakhir dengan arah pivot tertentu (Naik/Turun/Kedua-duanya).
- Penapis Jenis Formasi: Mengaktifkan/mematikan kategori corak tertentu.
LANGKAH 5 - VISUALISASI:
- Melukis garis sempadan atas dan bawah dengan warna terang dari palet 12 warna 🎨
- Pilihan memaparkan garis ayunan zigzag yang menghubungkan pivot (bertitik biru).
- Menunjukkan nombor pivot (1, 2, 3, 4, 5) pada setiap titik ayunan.
- Melabel formasi dengan nama corak pada pivot akhir.
- Kod warna latar belakang di belakang label untuk kejelasan.
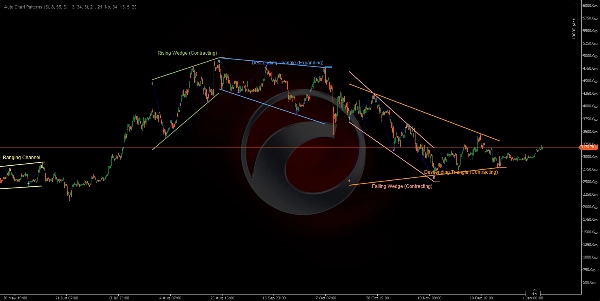
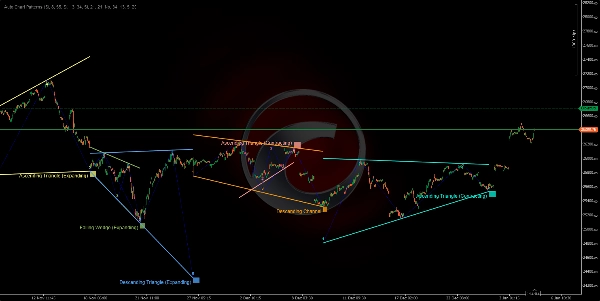
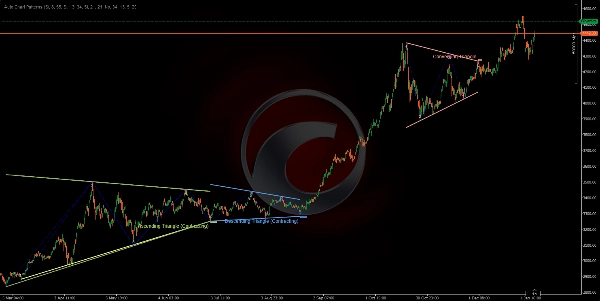
📐 14 FORMASI YANG DIKESAN
SALURAN (Formasi Selari) 📦
- Saluran Menaik (Selari Naik) 📈
-
- Kedua-dua sempadan condong ke atas pada sudut yang serupa.
- Menunjukkan tren sambungan menaik.
- Dagangan: Beli di sempadan bawah, jual di sempadan atas.
- Saluran Menurun (Selari Turun) 📉
-
- Kedua-dua sempadan condong ke bawah pada sudut yang serupa.
- Menunjukkan tren sambungan menurun.
- Dagangan: Jual di sempadan atas, beli di sempadan bawah.
- Saluran Mendatar (Lateral/Mendatar) ↔️
-
- Kedua-dua sempadan hampir mendatar.
- Menunjukkan pengukuhan atau ketidaktentuan.
- Dagangan: Strategi julat, beli sokongan/jual rintangan.
BAJI MELEBAR (Formasi Membesar) 📣
4. Baji Menaik (Melebar) ⚠️
* Kedua-dua sempadan condong ke atas, dengan jurang yang melebar.
* Corak pembalikan menurun - harga kehilangan momentum naik.
* Dagangan: Tunggu pecahan sempadan bawah, masuk posisi jual.
5. Baji Menurun (Melebar) ⚠️
* Kedua-dua sempadan condong ke bawah, dengan jurang yang melebar.
* Corak pembalikan menaik - harga kehilangan momentum turun.
* Dagangan: Tunggu pecahan sempadan atas, masuk posisi beli.
6. Segitiga Divergen (Segitiga Membesar) 🔺
* Sempadan atas condong ke atas, sempadan bawah condong ke bawah.
* Corak pengembangan volatiliti tinggi.
* Dagangan: Sangat berisiko, tunggu pecahan arah yang jelas.
7. Segitiga Menaik (Melebar) 📊
* Sempadan atas mendatar, sempadan bawah condong ke atas.
* Sambungan menaik dengan julat yang melebar.
* Dagangan: Beli pecahan sempadan atas.
8. Segitiga Menurun (Melebar) 📊
* Sempadan bawah mendatar, sempadan atas condong ke bawah.
* Sambungan menurun dengan julat yang melebar.
* Dagangan: Jual pecahan sempadan bawah.
BAJI MENYEMPIT (Formasi Menyempit) 🔻
9. Baji Menaik (Menyempit) 🔺
* Kedua-dua sempadan condong ke atas, dengan jurang yang menyempit.
* Corak pembalikan menurun - keletihan menaik ⚠️
* Dagangan: Jual apabila pecahan sempadan bawah.
10. Baji Menurun (Menyempit) 🔻
* Kedua-dua sempadan condong ke bawah, dengan jurang yang menyempit.
* Corak pembalikan menaik - keletihan menurun ⚠️
* Dagangan: Beli apabila pecahan sempadan atas.
SEGITIGA MENYEMPIT (Formasi Pengukuhan) △
11. Segitiga Menyempit (Segitiga Simetri) ⚖️
* Sempadan atas condong ke bawah, sempadan bawah condong ke atas pada kadar yang serupa.
* Pengukuhan neutral - corak sambungan.
* Dagangan: Tunggu arah pecahan, berdagang mengikutnya.
12. Segitiga Menurun (Menyempit) 📐
* Sempadan bawah mendatar (sokongan), sempadan atas condong ke bawah.
* Corak sambungan menurun 🔴
* Dagangan: Jual apabila sokongan pecah dengan volum.
13. Segitiga Menaik (Menyempit) 📐
* Sempadan atas mendatar (rintangan), sempadan bawah condong ke atas.
* Corak sambungan menaik 🟢
* Dagangan: Beli apabila rintangan pecah dengan volum.
14. Tidak Sah/Tidak Diketahui ❌
* Corak yang tidak memenuhi kriteria geometri.
* Ditapis secara automatik.
Ringkasan
Key functionalities include identifying potential breakout zones, visualizing market structure through geometric price relationships, and supporting trading of continuation and reversal patterns with visual confirmation. Users can filter detected patterns by trend direction, pivot type, and formation category. The indicator prevents overlapping and duplicate patterns to maintain clarity.
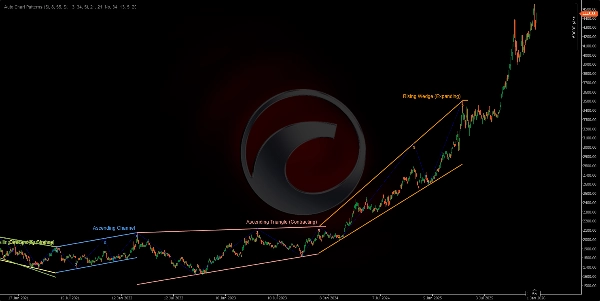
The 14 detected formations cover a range of classical patterns such as ascending, descending, and ranging channels; expanding and contracting wedges; and various triangle types (converging, diverging, ascending, descending). Visual outputs include color-coded boundary lines, pivot numbering, zigzag swing lines, and labeled pattern names for easy interpretation. This tool supports analysis across multiple markets including Forex, stocks, commodities, indices, and cryptocurrencies.
Ulasan pelanggan
5 | 50 % | |
4 | 50 % | |
3 | 0 % | |
2 | 0 % | |
1 | 0 % |


