
LT Flexible Volume Profile
Indikator
12 pembelian
Versi 1.0, Sep 2024
Windows, Mac
5.0
Ulasan: 3
Penerangan
Nota: Diuji hanya pada cTrader Windows.
Profil Isipadu
Satu lukisan profil menegak dalam carta harga untuk menunjukkan pada harga mana terdapat lebih/kurang isipadu (minat perdagangan).
Penunjuk Profil Isipadu Fleksibel
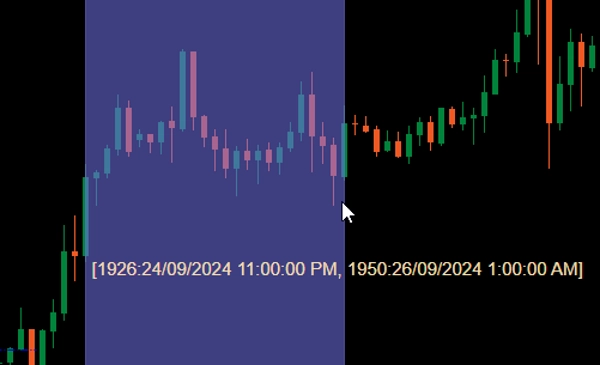
Apabila ditambah ke carta anda, seret Ctrl dengan tetikus kiri pada kawasan dalam carta harga untuk melukis profil bagi kawasan tersebut.
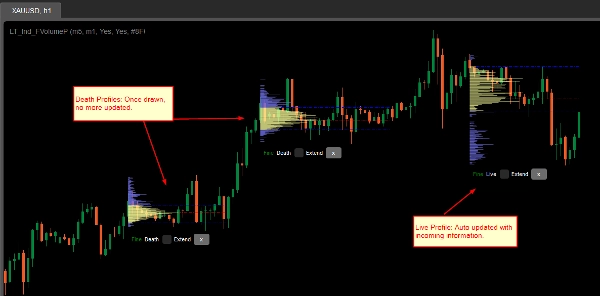
Untuk prestasi, profil akan dilukis dalam 2 keadaan:
- Profil kasar: Penunjuk akan menggunakan jangka masa yang ditetapkan oleh CoarseTF (lalai m5) untuk memuatkan maklumat isipadu, ini biasanya pantas. Semasa profil kasar dipaparkan, profil halus akan dimuatkan di latar belakang.
- Profil halus: Profil yang lebih tepat, menggunakan jangka masa yang ditetapkan oleh FineTF (lalai m1), tetapi anda boleh menetapkannya kepada yang paling halus (t1 - satu tik). Walau bagaimanapun, jika anda melihat carta Jangka Masa Harian atau lebih lama, menetapkan kepada jangka masa tik akan meningkatkan masa pemuatan.
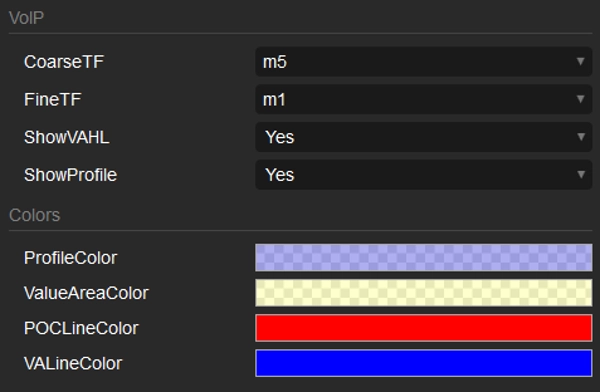
Parameter
- CoarseTF: Jangka masa untuk data kasar (lalai m5).
- FineTF: Jangka masa untuk data halus (lalai m1).
- ShowVAHL: Memaparkan VAH (Nilai Kawasan Tinggi) dan VAL (Nilai Kawasan Rendah).
- ShowProfile: Jika Ya maka memaparkan profil penuh, jika tidak hanya memaparkan VAH, VAL dan POC (Titik Kawalan).
- Colors: Penyesuaian warna.
Cara menggunakan
Selepas menambah penunjuk ke carta harga anda, gunakan seretan tetikus kiri Ctrl untuk memilih kawasan dalam carta yang anda ingin profilkan dan itu sahaja.
Selepas profil dipaparkan, anda akan melihat beberapa maklumat/pengendalian di bahagian bawah profil:
- Kasar/Halus: status profil.
- Mati/Hidup: jika profil anda merangkumi bar (lilin) terkini, maka ia adalah profil Hidup dan dikemas kini secara automatik dengan maklumat yang masuk.
- Kotak semak Extend: tandakan untuk melanjutkan garis VAH, VAL dan POC ke bar (lilin) terkini
- butang x: Klik untuk mengeluarkan profil dari carta.
Ringkasan
Ringkasan AI
LT Flexible Volume Profile is a volume profile indicator designed for use on price charts, primarily tested on cTrader Windows. It visually represents trading volume distribution across price levels within a selected chart area, highlighting where trading interest is higher or lower.
Users activate the profile by holding Ctrl and dragging the mouse over a desired chart region. The indicator operates in two modes for performance optimization: a Coarse profile using a configurable timeframe (default 5 minutes) for faster loading, and a Fine profile using a finer timeframe (default 1 minute, with an option down to single ticks) for more precise volume data.
Key parameters include:
- CoarseTF and FineTF: timeframes for coarse and fine volume data aggregation.
- ShowVAHL: toggles display of Value Area High (VAH) and Value Area Low (VAL).
- ShowProfile: controls whether the full profile or only key levels (VAH, VAL, Point of Control) are shown.
- Colors: customizable color settings.
After rendering, the profile provides status indicators (Coarse/Fine, Live/Dead), options to extend VAH, VAL, and POC lines to the latest bar, and the ability to remove the profile. This tool supports detailed volume analysis to assist traders in identifying significant price levels based on traded volume.
Profil indikator
Ulasan pelanggan
5.0
Ulasan: 3
5 | 100 % | |
4 | 0 % | |
3 | 0 % | |
2 | 0 % | |
1 | 0 % |
Ulasan pelanggan
October 1, 2024
Sensible product to test around volume based context. The useful part is checking participation, value areas and pressure, with the numbers checked before scaling. I would review 20 reactions near POC or VWAP before trusting the read. The data helps most when price action confirms the same zone.
September 30, 2024
September 30, 2024
Good tool for patience if the trader wants it adds useful information behind the price move. It works best as support, not a final decision maker. Volume context is stronger when POC, VWAP and value area agree across 2 sessions. volume alone can be noisy without price action.
Perbincangan
Soalan Lazim
Forex
Produk yang tersedia melalui cTrader Store, termasuk bot dagangan, indikator dan plugin, disediakan oleh pembangun pihak ketiga dan diberikan akses untuk tujuan maklumat dan teknikal sahaja. cTrader Store bukan broker dan tidak memberikan nasihat pelaburan, syor peribadi atau sebarang jaminan prestasi masa hadapan.


Harga
Sejak 25/09/2024
34
Jualan