present
Sign up and get $50 off your first purchase
Trading product for Axiom Matrix Indicator Volume Support & Resistance, image 1
Axiom Matrix
Indicator
Version 1.1, Oct 2026
Windows, Mac
Trading product for Axiom Matrix Indicator Volume Support & Resistance, image 2
Trading product for Axiom Matrix Indicator Volume Support & Resistance, image 3
Trading product for Axiom Matrix Indicator Volume Support & Resistance, image 4
Since 16/10/2026

Description

Axiom Matrix


One dashboard for comparing markets and choosing which chart to study next.


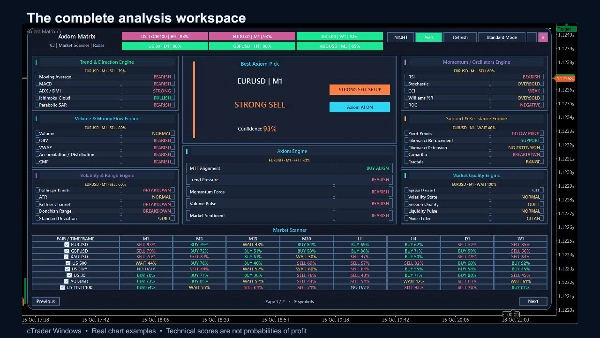
Axiom Matrix is a cTrader indicator that organises technical analysis across your watchlist. Its matrix brings symbols, timeframes and evidence together, so you can compare conditions without repeatedly opening each chart.


Seven connected analysis engines


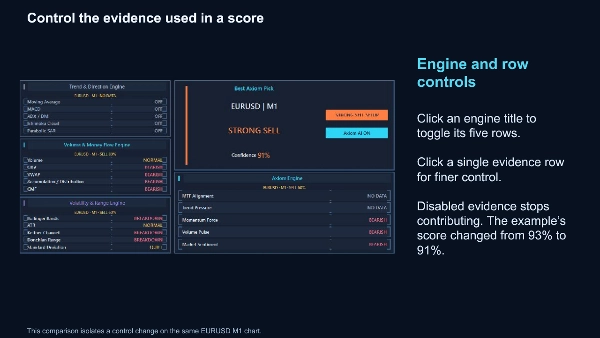
Trend & Direction, Volume, Volatility, Momentum, Support & Resistance, Market Quality and Axiom combine 35 evidence rows into a structured view. Inspect the reasoning on the current chart and enable or disable individual evidence rows or entire engines.


A practical market shortlist


Scan up to 27 broker-supported symbols across M1, M5, M15, M30, H1, H4, D1 and W1. Use a cTrader watchlist or enter exact broker symbol names. Include or exclude individual symbols and periods. Best Axiom Pick highlights the retained leading setup, while six ranked shortcuts make it easier to explore other candidates. Click a valid matrix cell or ranked pick to navigate to its chart.


Read the evidence, not just a signal


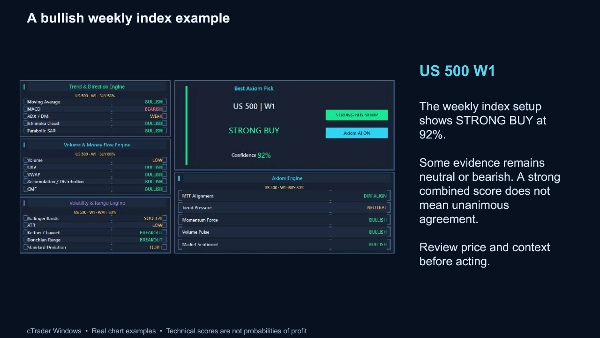
BUY, SELL and WAIT states summarise agreement between enabled technical rules. Confidence is a rule-based agreement score, not a probability of profit or a measured win rate. Axiom AI is the control for this technical analysis system; it does not use a remote prediction service. Volume calculations use the broker's tick-volume data.


An adaptable workspace


Choose Full or Standard view, light or dark styling, a chart-filling or movable panel, and configurable keyboard shortcuts. Panel preferences and evidence choices are retained. Optional current-chart arrows mark qualifying closed-bar decisions; they do not reconstruct a historical trade record.


Optional notifications


Configure desktop popups or email notifications for qualifying changes among the first three ranked setups. Email delivery requires working cTrader email settings and valid sender and recipient details. Initial historical setups are suppressed to avoid an alert burst when the indicator starts.


Getting started


Install the indicator in cTrader Windows, attach it to a chart, select your watchlist and allow history to load. Review a shortlisted chart and its evidence before making an independent trading decision. Missing, stale or insufficient data is shown explicitly. Available history and results depend on your broker and enabled settings.


Axiom Matrix supports manual analysis. It does not open, manage or close trades. Trading involves risk; technical signals can fail. Test your configuration on a demo account first.


Summary

Indicator profile
Indicator category
Support & resistance
Output type
Visualisation
Signals
Data requirements
Bars only
Volume
Supported signals
Trend strength

Discussion

Customer reviews

0.0
Reviews: 0
Customer reviews
No reviews for this product yet. Already tried it? Be the first to tell others!

FAQ

Volume
Support & Resistance
Products available through cTrader Store, including trading bots, indicators and plugins, are provided by third-party developers and made available for informational and technical access purposes only. cTrader Store is not a broker and does not provide investment advice, personal recommendations or any guarantee of future performance.

More from this author

Indicator
RSI
VWAP
+5
Trend direction, chart signals, reversal zones and volume tools in one configurable indicator.
Indicator
Volume
Order Block
+3
Map market structure, order blocks, liquidity and key zones with an interactive cTrader dashboard.
Indicator
Key Levels
Trend-filtered signals, transparent trade plans and a multi-timeframe decision panel for cTrader.
Indicator
Volume
Key Levels
+1
Six timeframe decisions, chart trade plans and historical risk simulation in one interactive cTrader indicator.
Indicator
Fibonacci
Key Levels
+1
Explore Elliott wave counts, three swing sizes and example levels with an interactive cTrader chart panel.
Indicator
ATR
Key Levels
+1
Explore 88 harmonic price-pattern variants with interactive chart controls and geometric reference levels.

You may also like

Indicator
Key Levels
Trend-filtered signals, transparent trade plans and a multi-timeframe decision panel for cTrader.
Indicator
SMC
Grid
+19
Smart fractals + auto Fibonacci + dynamic S/R zones with HTF confluence & Bull/Bear bias panel. Institutional-grade.
Indicator
AI
ATR
+19
QX SessionBox ORB: Session boxes + ORB levels + clean dashboard with optional closed-candle breakout signals.
Indicator
Forex
EURUSD
+5
With this Fibonacci retracement indicator, traders have full control over the retracement levels displayed on the chart.
Indicator
Forex
The cTrader Market Sessions Alerts Indicator marks global sessions, highlights key levels, and sends real-time alerts.
Indicator
ATR
Key Levels
+1
Explore 88 harmonic price-pattern variants with interactive chart controls and geometric reference levels.
Indicator
Prop
Forex
+5
Traders Panel: Scan 15 pairs across 5 timeframes. Live heatmap, strength rankings and best setups in one panel.
Indicator
ATR
EMA
+3
The UTBot you know from TradingView รขย€ย” now on cTrader with confirmed signals, VWAP, EMA and session overlays.
Indicator
ADX
ATR
+5
SuperTrend signals scored on five confluence factors, with an ATR stop, three targets and a dashboard.
Indicator
Supertrend
Moving Average
Easy Trade: Trend & Breakout Indicator for cTrader
Indicator
AI
ATR
+27
VolumeProfileSuite is an advanced and flexible Volume Profile indicator for cTrader.
Indicator
AI
ATR
+26
SR Commander โ€” Multi Timeframe Edition. See where the big money draws the line. Trade on your timeframe. Think on theirs
Indicator
ATR
RSI
+4
RSI bands drawn on price, confluence-scored BUY/SELL signals, an ATR stop with three targets
Indicator
Risk Dashboard
AI-powered daily range forecasts help traders spot volatility opportunities and plan stops and targets.
Indicator
RSI
Breakout
+1
๐Ÿš€ TrendHeikinMultiMA: Advanced trend detection using Heikin-Ashi smoothing & MAs! Eliminates noise, confirms real trend
Indicator
ATR
Forex
+9
Auto-detect swing highs/lows. Spot reversals, map structure, and filter noise with adjustable strength.
Indicator
SMC
Signal
+2
Gold Market Maker Zones; Non-repainting Supply & Demand detector for XAUUSD. Precise institutional zones for cTrader.
Indicator
SMC
Forex
+15
Session-based range tool projecting adaptive Gann & Fib levels with auto bias flip and extensions.

Price

Since 16/10/2026