説明
⭐ MULTI‑TIMEFRAME SMC ZONE™ 🇫🇮
5つの時間枠にわたる機関投資家の需給マッピング — 自動で。
プロフェッショナル製品
Multi‑Timeframe SMC Zone Engine™ は、精密に設計されたスマートマネーコンセプトのインジケーターで、5つの主要な時間枠にわたる機関投資家の需給ゾーンを自動で検出、描画、同期し、リアルタイムでチャート上に表示します。
市場構造、流動性の動き、機関投資家の足跡に依存するトレーダーのために設計されており、手動でのゾーンマーキングの推測や不確実性を排除します。デイトレードでもスイングトレードでも、Multi‑Timeframe SMC Zone Engine™ は市場が反応しやすい場所の完全で多層的な地図を提供します。
これは単なるインジケーターではありません。
それはマルチタイムフレームのSMCインテリジェンスシステムです。
コア機能
自動需給ゾーン検出
エンジンは各時間枠の直近X本のバー(ユーザー定義)をスキャンし、以下を識別します:
需要ゾーン(強気のアンバランス)
供給ゾーン(弱気のアンバランス)
ゾーンはローソク足の構造で検証され、意味のある機関投資家の足跡のみが表示されます。
5つの時間枠、1つのチャート
インジケーターは同時に分析します
日足
4時間足
1時間足
30分足
15分足
各時間枠には独自の色が割り当てられ、高時間枠の強さと低時間枠の精度をクリーンで層状に表示します。
このマルチタイムフレームの融合こそが、SMCトレーダーが流動性の掃き出し、緩和ブロック、プレミアム/ディスカウントゾーンを予測するために頼るものです。
動的ゾーン投影
すべてのゾーンは最新のローソク足まで自動的に延長され、以下を確認できます:
価格が反応しそうな場所
まだ有効なゾーン
現在の価格が機関投資家の足跡とどのように相互作用しているか
手動での再描画不要。混雑なし。古いゾーンなし。
プロフェッショナルなビジュアル
各ゾーンには以下が含まれます:
調整可能な境界線幅のカラー長方形
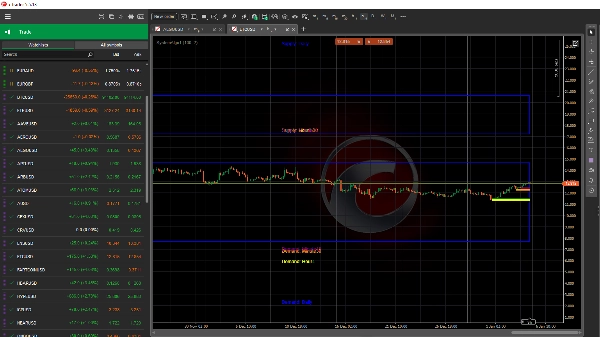
明確なテキストラベル(「Demand: H1」「Supply: M15」など)
ローソク足と重ならないように左寄せでスマートに配置
結果はクリーンで読みやすく、プロフェッショナルグレードのSMCマップです。
トレーダーが愛用する理由
手動でのゾーンマーキングを排除
即座にマルチタイムフレームのコンテキストを提供
高確率の反応ポイントを特定するのに役立つ
SMC、ICT、Wyckoff、流動性コンセプトに基づくあらゆる戦略で機能
チャートを圧迫しないクリーンなビジュアル
デイトレスキャルパーとスイングトレーダーの両方に最適
複雑さなしに機関投資家の視点を提供します。
このインジケーターが対象とする人
スマートマネーコンセプトのトレーダー
ICTスタイルの流動性トレーダー
市場構造およびオーダーフロートレーダー
精度を求めるスキャルパー
高時間枠のコンテキストを必要とするスイングトレーダー
クリーンで自動化された需給マップを求めるすべての人
⭐ MULTI‑TIMEFRAME SMC ZONE™
重要なすべての時間枠で機関投資家の足跡の明確さをもって取引しましょう
注意事項
青 = 日足の需要/供給
緑 = 4時間足の需要/供給
黄 = 1時間足の需要/供給
ダークバイオレット = 15分の需要/供給
ピンク = 5分の需要/供給
重なりがある場合 > 成功する取引の可能性が高まります
概要
The indicator assigns unique colors to each timeframe’s zones for clear, layered visualization, enabling traders to assess higher-timeframe strength alongside lower-timeframe precision. Zones are dynamically extended to the latest candle, showing active areas where price is likely to react without manual redrawing or clutter.
Each zone is visually marked with a colored rectangle, adjustable border width, and clear text labels indicating timeframe and zone type, placed to avoid overlap with price candles. This tool supports trading strategies based on market structure, liquidity, and institutional footprints, including SMC, ICT, Wyckoff, and liquidity concepts.
SystemAlgo1 is suitable for intraday scalpers and swing traders seeking automated, multi-timeframe supply and demand mapping to identify high-probability reaction points across markets such as Forex, cryptocurrencies, indices, commodities, and stocks.