
Descripción
Explicación de la Estrategia de Seguimiento de Tendencias en Forex (Inglés)
Esta estrategia de seguimiento de tendencias está diseñada para identificar tendencias fuertes del mercado usando Medias Móviles Exponenciales (EMAs), MACD y ADX. Genera señales de compra y venta basadas en el impulso y la fuerza de la tendencia.
Cómo Funciona
1️⃣ Identificación de la Dirección de la Tendencia
- EMA Rápida (21) y EMA Lenta (50) determinan la dirección general de la tendencia:
-
- Tendencia Alcista → La EMA Rápida está por encima de la EMA Lenta
- Tendencia Bajista → La EMA Rápida está por debajo de la EMA Lenta
2️⃣ Medición del Impulso de la Tendencia (Histograma MACD)
- El histograma MACD confirma el impulso:
-
- Impulso Alcista → El histograma MACD está por encima de cero
- Impulso Bajista → El histograma MACD está por debajo de cero
3️⃣ Verificación de la Fuerza de la Tendencia (Indicador ADX)
- El ADX (14) mide la fuerza de la tendencia:
-
- Tendencia Fuerte → El ADX está por encima de 25
- Tendencia Débil → El ADX está por debajo de 25 (sin señales)
Ejecución de la Operación
✅ Señal de Compra (Entrada Alcista)
- EMA Rápida > EMA Lenta (Tendencia Alcista)
- Histograma MACD > 0 (Confirmación de impulso)
- ADX > 25 (Tendencia fuerte)
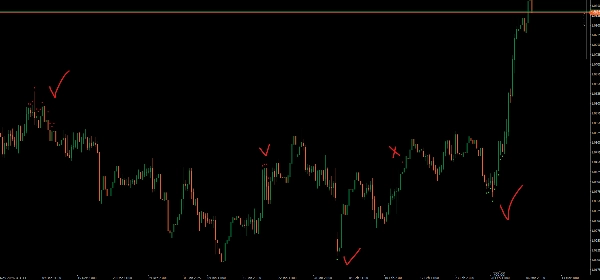
- 🔹 Flecha de compra aparece debajo del precio mínimo
❌ Señal de Venta (Entrada Bajista)
- EMA Rápida < EMA Lenta (Tendencia Bajista)
- Histograma MACD < 0 (Confirmación de impulso)
- ADX > 25 (Tendencia fuerte)
- 🔻 Flecha de venta aparece encima del precio máximo
Características Clave
✔ Evita tendencias débiles usando ADX
✔ Filtra señales falsas con confirmación MACD
✔ Parámetros ajustables para mejor personalización
Este indicador ayuda a los traders a seguir tendencias fuertes mientras evitan condiciones de mercado débiles. 🚀


![Logotipo de "Trend Angle Indicator [Iridio Capital]"](https://cdn.ctrader.com/image/webp/28a98496-3412-4fea-82eb-be3347bdd6f1_27612)


