
설명
이것은 BlackScholes 모델을 사용하여 옵션 가격을 계산하기 위해 cTrader 내에서 ‘Math.Numerics’ 패키지를 사용하는 매우 간단한 예제입니다.
향후 버전에는 더 정교한 구현이 포함될 예정입니다.
현재로서는 지수에만 사용해야 합니다, 감사합니다.
행운을 빕니다!
요약
AI 요약
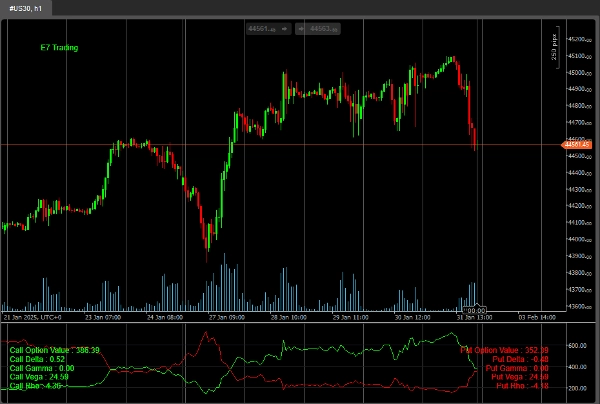
E7 BlackScholes Model is an indicator designed for use within the cTrader platform that calculates option pricing based on the Black-Scholes model. It utilizes the Math.Numerics package to perform these calculations. Currently, the tool is intended primarily for indices such as NASDAQ, S&P 500, DAX, and Dow. The product offers a straightforward implementation of the Black-Scholes formula, with plans for more advanced versions in the future. This indicator assists traders in evaluating option prices on index markets by providing mathematical option valuation directly integrated into their trading environment.
지표 프로필
고객 리뷰
5.0
리뷰: 1
5 | 100 % | |
4 | 0 % | |
3 | 0 % | |
2 | 0 % | |
1 | 0 % |
고객 리뷰
August 18, 2025
Pros: Calculates Black–Scholes theoretical option price and Greeks (Delta, Gamma, Theta, Vega) in real‑time. Lightweight and intuitive interface. Great for risk management and option analysis. Cons: No alerts or tooltips. Lacks template saving and real‑price comparison. Assumes constant volatility
상담
자주 묻는 질문(FAQ)
Indices
트레이딩 봇, 지표, 플러그인 등 cTrader Store에서 제공되는 상품은 제3자 개발자에 의해 제공되며, 이는 단순히 정보 및 기술적 접근을 목적으로 제공된 것입니다. cTrader Store는 중개인이 아니며, 투자 조언, 개인별 추천 또는 향후 성과에 대한 어떠한 보장도 제공하지 않습니다.


!["Trend Angle Indicator [Iridio Capital]" 로고](https://cdn.ctrader.com/image/webp/28a98496-3412-4fea-82eb-be3347bdd6f1_27612)


가격
가입일 18/12/2024
2
판매
4.24K
무료 설치