
설명
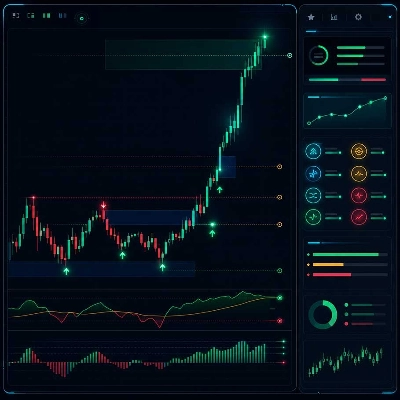
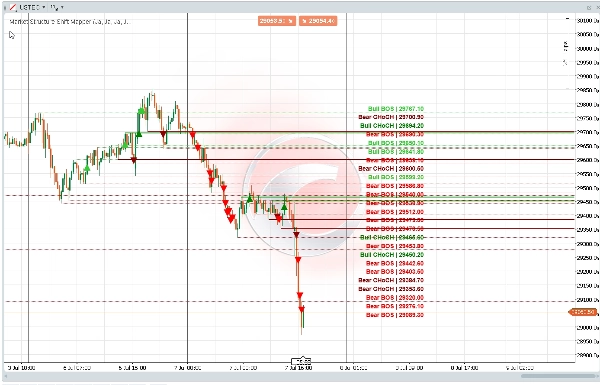
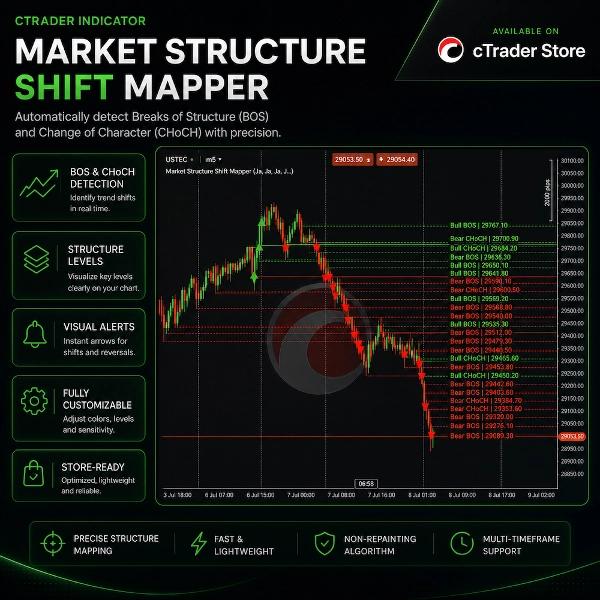
Market Structure Shift Mapper는 차트에서 직접 구조 붕괴와 시장 구조 변화를 식별하도록 설계된 시각적 cTrader 지표입니다.
이 지표는 스윙 고점과 스윙 저점을 감지한 후, 가격이 관련 구조 수준을 돌파할 때 강세 및 약세 BOS 또는 CHoCH 이벤트를 표시합니다. 구조선, 붕괴 화살표 및 시각적 중첩을 줄이기 위한 스택형 라벨 배치가 가능한 깔끔한 오른쪽 가장자리 라벨을 표시할 수 있습니다.
이 도구는 임의의 가격 행동 분석, 시장 구조 검토, 유동성 기반 차트 준비 및 백테스팅 연구를 위해 설계되었습니다.
주요 기능:
- 강세 BOS 감지
- 약세 BOS 감지
- 강세 CHoCH 감지
- 약세 CHoCH 감지
- 스윙 고점 및 스윙 저점 감지
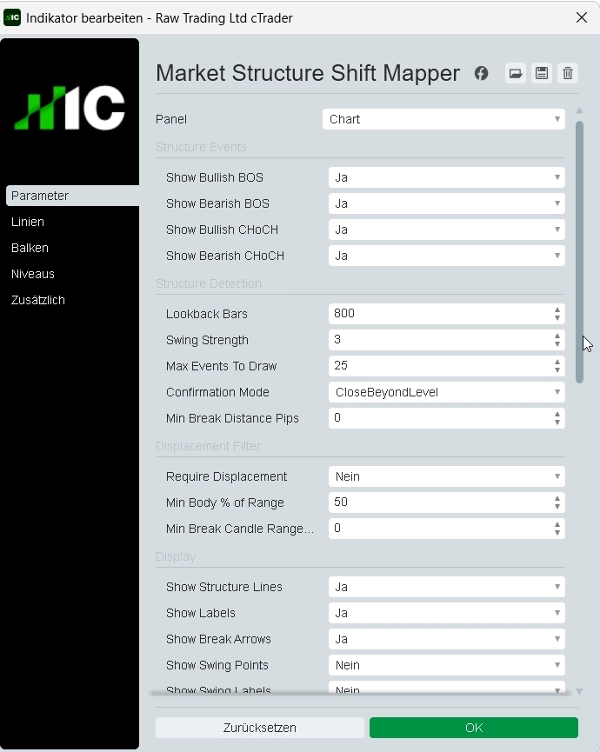
- 종가 기반 또는 심지 기반 확인
- 선택적 변위 필터
- 구조 붕괴 화살표
- 구조 수준 선
- 선택적 스윙 포인트 마커
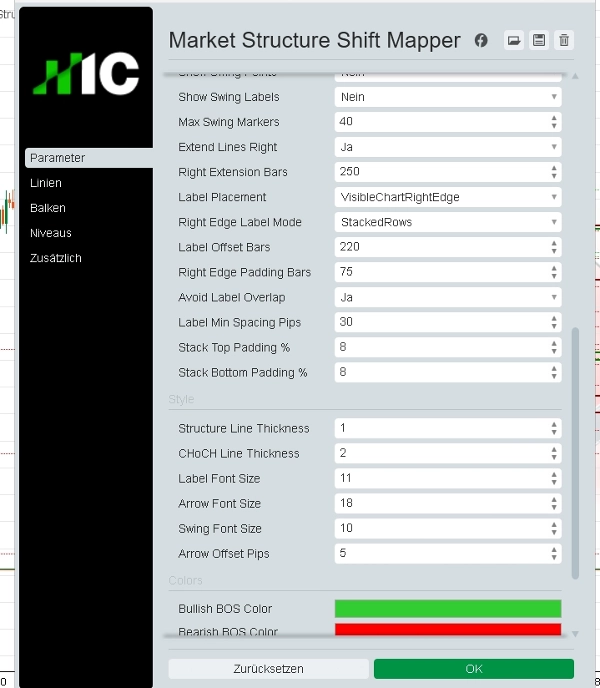
- 오른쪽 가장자리 스택형 라벨
- 라벨 중첩 방지
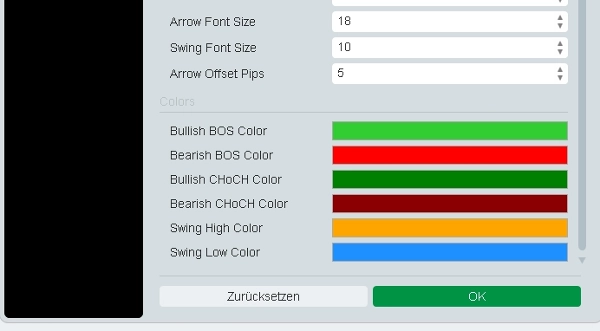
- 사용자 정의 색상 및 선 설정
- 깔끔한 차트 오버레이
- 제한된 접근 권한을 가진 스토어 안전 지표
Market Structure Shift Mapper는 거래 로봇이 아닙니다. 거래를 실행하거나 주문을 수정하거나 보장된 매수/매도 신호를 제공하지 않습니다. 시각적 분석 및 시장 맥락 도구일 뿐입니다.
거래에는 위험이 따릅니다. 이 지표는 금융 조언, 투자 권고, 통계적 확률 또는 보장된 거래 결과를 제공하지 않습니다.
요약
AI summary
Market Structure Shift Mapper is a visual indicator for the cTrader platform that identifies and maps key market structure events directly on price charts. It detects swing highs and lows, then highlights bullish and bearish Break of Structure (BOS) and Change of Character (CHoCH) events when price breaks relevant levels. The indicator visually displays structure lines, break arrows, and right-edge stacked labels designed to minimize overlap for clearer chart interpretation.
Key features include:
- Detection of bullish and bearish BOS and CHoCH
- Swing high and low identification
- Close-based or wick-based confirmation options
- Optional displacement filtering
- Visual markers for structure breaks and swing points
- Customizable colors and line styles
- Clean chart overlay with label overlap protection
This tool supports discretionary price action analysis, market structure review, liquidity-based chart preparation, and backtesting research. It functions solely as a visual analysis aid and does not execute trades, modify orders, or provide trading signals or financial advice.
Key features include:
- Detection of bullish and bearish BOS and CHoCH
- Swing high and low identification
- Close-based or wick-based confirmation options
- Optional displacement filtering
- Visual markers for structure breaks and swing points
- Customizable colors and line styles
- Clean chart overlay with label overlap protection
This tool supports discretionary price action analysis, market structure review, liquidity-based chart preparation, and backtesting research. It functions solely as a visual analysis aid and does not execute trades, modify orders, or provide trading signals or financial advice.
지표 프로필
지표 카테고리
시장 구조 (SMC)
출력 유형
시각화
데이터 요구 사항
막대만
지원되는 신호
레벨 터치
레벨 돌파
다이버전스
추세 강도
고객 리뷰
5.0
리뷰: 1
5 | 100 % | |
4 | 0 % | |
3 | 0 % | |
2 | 0 % | |
1 | 0 % |
고객 리뷰
July 19, 2026
Market Structure Shift Mapper is a clean, highly effective SMC tool for cTrader. It detects swing points and auto-labels BOS/CHoCH events. The label overlap protection keeps the chart readable, while the displacement filter and close/wick confirmations give excellent signal control. Though the last swing repaints until confirmed and alerts are missing, it’s a top-tier visual mapper for price action and liquidity-based trading.
상담
자주 묻는 질문(FAQ)
Key Levels
MSS
BOS
CHOCH
Market Structure
트레이딩 봇, 지표, 플러그인 등 cTrader Store에서 제공되는 상품은 제3자 개발자에 의해 제공되며, 이는 단순히 정보 및 기술적 접근을 목적으로 제공된 것입니다. cTrader Store는 중개인이 아니며, 투자 조언, 개인별 추천 또는 향후 성과에 대한 어떠한 보장도 제공하지 않습니다.