
Descripción
TIB — Indicador de Barras de Desequilibrio de Ticks. Detecta Información del Mercado Antes de que el Precio se Mueva
Versión 2.0
Utilice la sección de comentarios para pedir más detalles
Disponible para sesión en video con guía de configuración después de la compra
Las Barras de Desequilibrio de Ticks llevan el análisis de microestructura del mercado de grado institucional a cTrader. Basado en la investigación innovadora de Marcos López de Prado, detallada en su libro Advances in Financial Machine Learning, este indicador muestrea los datos de precios no por tiempo o volumen, sino por la llegada de información.
La Idea Central
Las barras tradicionales (de tiempo, tick, volumen) muestrean los mercados de manera uniforme, perdiendo momentos críticos cuando los traders informados actúan. Las Barras de Desequilibrio de Ticks resuelven esto detectando cuando la presión de compra o venta excede los niveles esperados, señalando la presencia de traders informados y un posible movimiento de precio antes de que el mercado alcance el equilibrio.
Cómo Funciona
El indicador aplica la regla de ticks para clasificar cada operación como presión de compra (+1) o venta (-1). Luego acumula estos ticks firmados hasta que el desequilibrio acumulado (θT) supera un umbral dinámico calculado usando un Promedio Móvil Exponencialmente Ponderado (EWMA). Este umbral esperado se adapta a las condiciones del mercado analizando la probabilidad histórica de ticks de compra vs. venta. Cuando se supera el umbral, se crea una nueva barra TIB, cada barra contiene aproximadamente cantidades iguales de información del mercado, independientemente del volumen o tiempo transcurrido.
Características Clave
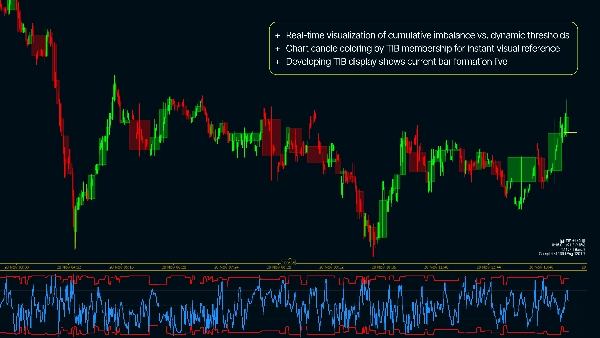
- Visualización en tiempo real del desequilibrio acumulado frente a umbrales dinámicos
- Coloreado de velas en el gráfico por membresía TIB para referencia visual instantánea
- Visualización de TIB en desarrollo que muestra la formación de la barra actual en vivo
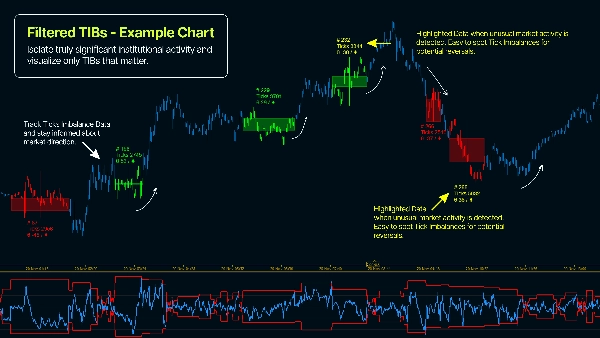
- Filtro de Ticks Mínimos para mostrar solo barras estadísticamente significativas
- Tamaño esperado de barra y parámetros EWMA totalmente configurables
- Métricas del panel que rastrean la intensidad del desequilibrio y la densidad de información
¿Por Qué Usar Barras de Desequilibrio de Ticks?
- Muestreo más frecuente durante períodos de alta información, capturando volatilidad accionable
- Detectar actividad de trading informada antes de que se alcance el equilibrio de precios
- Reducir el ruido de participantes de mercado no informados y flujo de órdenes minoristas
- Lograr mejores propiedades estadísticas (retornos IID similares a Gaussianos) que el muestreo basado en tiempo
- Aplicar metodología cuantitativa probada usada por traders institucionales
- Identificar información asimétrica en el flujo de órdenes, un predictor probado de la dirección del precio
Guía Práctica de Configuración para la Configuración Base ( ! )
- Aplicar el indicador en el marco temporal de 1 minuto (o menor - usar gráficos basados en ticks)
- E[T] - Ingresar Ticks Esperados por barra para muestreo (comenzar con 1000)
- EWMA Alpha - [0,001 - 0,5], donde 0,001 producirá resultados más estables (en teoría) mientras que 0,5 producirá TIBs basados en datos más recientes
- Desequilibrio Inicial - recomendado 0,5 pero puede experimentar (0,5 = desequilibrio neutral en la inicialización)
Resumen
Valoraciones de clientes
5 | 100 % | |
4 | 0 % | |
3 | 0 % | |
2 | 0 % | |
1 | 0 % |


