Descripción
La mayoría de los indicadores de tendencia responden a la misma pregunta de la misma manera: suavizan el precio, dibujan algunas líneas, buscan cruces. El Canal de Precio FDQ se construyó alrededor de una pregunta diferente — qué está haciendo realmente el precio, despojado de ruido y deriva, y qué te dice eso sobre hacia dónde es probable que vaya.
El resultado es un indicador de tendencia basado en canales que combina tres capas analíticas distintas en una sola superposición legible.
- Puntos Clave
Un Punto de Partida Diferente. La serie de precios que la mayoría de los indicadores usan es, estadísticamente, un problema.
Los precios en bruto contienen un componente de caminata aleatoria que oscurece la estructura significativa. Antes de dibujar cualquier canal, FDQ aplica una transformación de diferenciación fraccional — una técnica tomada de la investigación cuantitativa — que elimina esta deriva mientras preserva deliberadamente la memoria a largo plazo en los datos. Lo que queda es una serie transformada que aún refleja dónde ha estado el mercado, pero que ya no está dominada por dónde se encuentra actualmente. Esta es la base sobre la que se construye todo lo demás.
- El Ruido Tiene un Costo
Cada método de suavizado basado en retrasos intercambia el tiempo por precisión. El filtrado de Kalman no.
El filtro de Kalman es un proceso de estimación recursiva: actualiza continuamente su visión del mercado, equilibrando cuánto confiar en los nuevos datos frente a lo que ya ha establecido. A diferencia de un promedio móvil, no tiene una ventana fija de retroceso y no trata todos los barras pasadas por igual. La salida es una representación más limpia del precio que responde rápidamente a movimientos genuinos y resiste reaccionar al ruido — sin las señales retrasadas que típicamente produce el suavizado.
- Bandas Construidas a partir del Comportamiento, No de Fórmulas
Las bandas de desviación estándar asumen que el precio se distribuye normalmente. Rara vez es así.
Los límites del canal FDQ se definen usando análisis de cuantiles — la distribución estadística real del precio transformado durante el período de retroceso. La banda alta marca el nivel que la serie realmente alcanza en el extremo superior de su rango; la banda baja hace lo mismo en el extremo inferior. Estos no son límites teóricos calculados a partir de una media — reflejan dónde el precio realmente se ha negociado, lo que los hace más sensibles a cómo se está comportando realmente el mercado en cualquier momento dado.
- Una Segunda Capa Dentro del Canal
Las bandas exteriores definen el rango. Las bandas interiores definen la zona.
Un segundo conjunto de bandas se sitúa proporcionalmente entre el canal exterior y su línea media. Esta capa interior crea una zona de trading distinta — más estrecha que el canal completo, anclada a la misma base estadística — que sirve como referencia graduada para entradas y clasificación de señales.
- Estado de la Tendencia Antes que Todo
Una señal sin contexto es solo un dato aleatorio.
El indicador rastrea el estado direccional del canal continuamente, usando un mecanismo de voto mayoritario entre los tres componentes de la banda. Cuando al menos dos de los tres se mueven en la misma dirección, el estado de la tendencia se confirma como Ascendente o Descendente. Las señales solo se generan en alineación con el estado actual — configuraciones largas solo en condiciones Ascendentes, configuraciones cortas solo en Descendentes. Cuando el mercado no cumple con este umbral, no se declara ningún estado y no se generan señales. Las transiciones entre estados se marcan como líneas verticales directamente en el gráfico.
- Tres Configuraciones Distintas de Rebote
No todos los retrocesos son iguales. El indicador reconoce tres gradaciones.
Una vez que un estado de tendencia está activo, el indicador observa patrones específicos de rebote — momentos en que el precio se ha movido en contra de la tendencia, tocó un nivel definido y revirtió atravesándolo nuevamente.
-
- Rebote Medio — El precio cae por debajo (o sube por encima) de la línea media del canal y se recupera. Un retroceso estándar dentro de una tendencia.
- Rebote Profundo — El precio se extiende más, alcanzando el extremo de la banda interior antes de recuperarse. Un retroceso más comprometido con una reversión más decisiva.
- Rebote Ligero — El precio toca la banda interior en el lado de la tendencia y rebota. El más superficial de los tres, ocurriendo con mayor frecuencia.
Cada tipo es visualmente distinto en el gráfico y puede ser habilitado o deshabilitado de forma independiente.
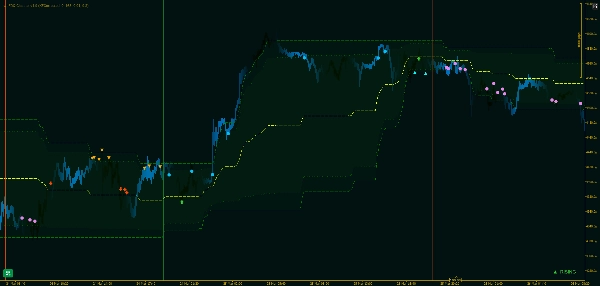
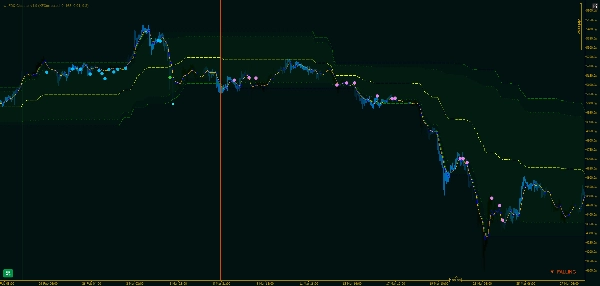
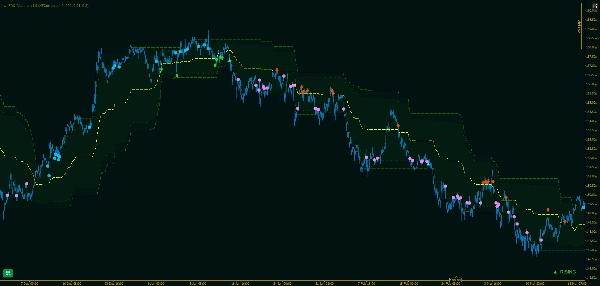
- Lo Que Ves
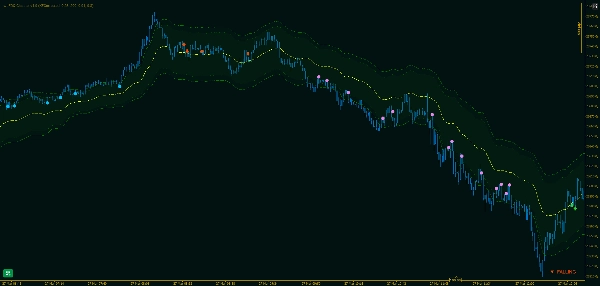
El gráfico cuenta la historia directamente, sin interpretación.
El canal principal, las bandas interiores y la línea media superponen el precio como líneas continuas. Las transiciones de régimen se marcan con líneas verticales — verdes para Ascendente, rojas para Descendente — para que la historia de los cambios de estado de tendencia sea visible de un vistazo. Los marcadores de señal aparecen en la barra donde se confirma cada rebote, con íconos separados para cada tipo de señal y dirección.
- Por Qué Este Enfoque Funciona
La mayoría de los indicadores de canal se retrasan cuando los mercados se mueven rápido y reaccionan en exceso cuando no lo hacen.
Porque el canal FDQ se construye sobre una transformación estacionaria que preserva la memoria en lugar de un promedio móvil, las bandas se ajustan a la distribución del comportamiento real en lugar de perseguir el precio. La capa de Kalman mantiene la estimación subyacente limpia sin introducir el costo de tiempo que conlleva el suavizado con ventana. El resultado es un canal que se mantiene significativo en diferentes condiciones de mercado — en tendencia, en rango y en transición — sin necesidad de ajustes manuales.
Resumen
The channel boundaries are defined by quantile analysis of the transformed price distribution rather than standard deviation, capturing actual price extremes over the lookback period. It features outer bands marking the full range and inner bands creating a narrower trading zone for refined entry signals. The indicator continuously tracks trend direction using a majority vote across three band components, confirming Rising or Falling states and marking transitions with vertical lines on the chart.
Within active trends, wt.FDQ Channel identifies three distinct rebound setups—Light, Mid, and Deep—each representing different pullback intensities and reversal confirmations. These signals are visually distinct and configurable. The overlay displays the primary channel, inner bands, midline, trend states, and rebound signals directly on the price chart, supporting analysis across various markets including Forex, indices, and cryptocurrencies.
Valoraciones de clientes
5 | 100 % | |
4 | 0 % | |
3 | 0 % | |
2 | 0 % | |
1 | 0 % |


