
Opis
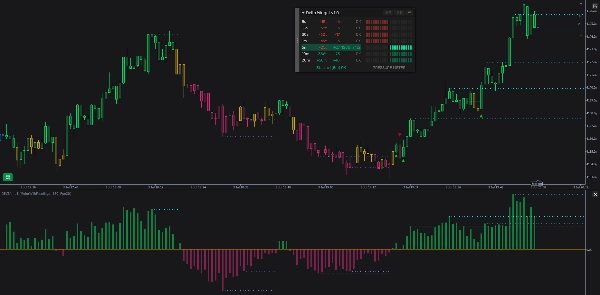
Wskaźnik obserwuje strumień ticków na żywo i dla każdego włączonego interwału czasowego (od 5 sekund do 20 minut) utrzymuje przesuwane okno ostatniej aktywności. W każdym oknie porównuje dwie rzeczy: w którą stronę cena się poruszyła oraz w którą stronę przepływ zleceń się skłaniał (szacowanie presji kupna/sprzedaży odbudowane na podstawie ruchu ticków, ponieważ cTrader nie publikuje rzeczywistego wolumenu). Gdy cena i przepływ wskazują ten sam kierunek, interwał czasowy pokazuje OK. Gdy się nie zgadzają, sygnalizuje dywergencję — BULL, gdy cena spada, ale przepływ kupuje, BEAR, gdy cena rośnie, ale przepływ sprzedaje — i mierzy, jak długo trwa ta niezgodność. Wszystko to jest prezentowane za pomocą panelu przeciąganego na wykresie (odczyt dla każdego interwału plus linia łączna z werdyktem oraz opcjonalny miernik presji kupna/sprzedaży), opcjonalnego kolorowania świec, które barwi świece według dominującego kierunku, histogramu w podpane, markerów przy zmianie dominującego kierunku, opcjonalnych poziomów odniesienia ułatwiających dostrzeżenie dywergencji między ceną a histogramem oraz opcjonalnych alertów dźwiękowych, które dają sygnały audio bez konieczności patrzenia na ekran.
Szacowanie przepływu (podstawa)
cTrader nie udostępnia rzeczywistego wolumenu kupna/sprzedaży, więc wskaźnik szacuje przepływ na podstawie samego ruchu cen: każdy ruch w górę jest liczony jako kupno, każdy ruch w dół jako sprzedaż, a tick bez zmiany ceny albo utrzymuje poprzednie nastawienie, albo jest liczony jako neutralny (do wyboru — patrz Flat Tick Carry). Aby uniknąć błędów spowodowanych migotaniem spreadu bid/ask, cena jest odczytywana jako mid-price (punkt środkowy między bid a ask).
Każdy tick jest przetwarzany raz i przechowywany w wspólnej puli, z której odczytują wszystkie interwały, więc nic się nie duplikuje, a pamięć pozostaje niewielka nawet przy włączonych wszystkich interwałach. Każdy interwał po prostu patrzy na wycinek tej puli w swoim własnym oknie.
Dla każdego okna wskaźnik śledzi:
- Ruch ceny — jak daleko cena przemieściła się w oknie, podawane w tickach (najmniejszy przyrost ceny instrumentu).
- Przepływ (delta) — netto nastawienie kupna minus sprzedaż w tym samym oknie.
Interwały czasowe
Jest jeden wiersz na każdy włączony interwał, zawsze uporządkowany od najkrótszego do najdłuższego: 5s, 15s, 30s, 1m, 5m, 10m, 20m. Ten porządek jest też kolejnością w panelu i decyduje o wadze, jaką każdy interwał ma przy kolorowaniu świec — wolniejsze interwały mają większy wpływ.
Po załadowaniu wskaźnik rozgrzewa każdy interwał, odtwarzając niedawną historię dokładnie tą samą ścieżką, którą podążają ticki na żywo, więc każdy wiersz jest od razu znaczący, zamiast zaczynać pusty i wypełniać się w czasie rzeczywistym (patrz Preload History i Max History Bars).
Panel
Na wykresie znajduje się panel, który można przeciągać. Ma pasek tytułu z trzema przyciskami, obszar, który może pokazywać tabelę odczytów, miernik presji lub oba, oraz linię łączną z werdyktem.
Tabela odczytów
Jeden wiersz na interwał, z czterema kolumnami:
- TF — etykieta interwału (5s, 15s, …20m).
- Cena — ruch ceny w oknie w tickach, z oznaczeniem (np.
+350tlub-650t). Zielony, gdy w górę, czerwony, gdy w dół. - Delta — nastawienie przepływu jako liczba ze znakiem (np.
+16lub-12). Zielony, gdy dominuje kupno, czerwony, gdy sprzedaż. Duże wartości są skracane z użyciemk(np.+1,2k). - Status —
OK, gdy cena i przepływ się zgadzają, lub strzałka plus czas trwania, gdy interwał jest w dywergencji:↗ 2m 15sdla dywergencji BULL,↘ 45sdla BEAR. Cały wiersz jest lekko zielony (BULL) lub lekko czerwony (BEAR), gdy dywergencja jest aktywna.
Miernik presji
Alternatywny (lub dodatkowy) widok, który zamienia każdy wiersz interwału w wykres słupkowy presji kupna/sprzedaży na lewo/prawo. Od cienkiej linii środkowej presja sprzedaży podświetla komórki w lewo, a presja kupna podświetla komórki w prawo. Liczba podświetlonych komórek odzwierciedla, jak bardzo dany interwał jest obciążony względem własnej niedawnej normy, więc szybki i wolny interwał są pokazywane względem własnej bazy, a nie względem siebie nawzajem. Podświetlone komórki rozjaśniają się, gdy interwał jest w prawdziwej dywergencji BULL lub BEAR. Pod nim znajduje się tytuł "PRESSURE METER" i własna linia werdyktu.
W układzie both miernik i tabela odczytów pojawiają się obok siebie i dzielą jedną linię werdyktu.
Kolorowanie świec (reżim)
Opcjonalnie wskaźnik koloruje świece cenowe według dominującego kierunku — reżimu — który jest bardziej stabilnym odczytem niż pojedynczy interwał. Może to być Bull, Bear lub Conflict i jest utrzymywany z wbudowaną przyczepnością, więc pozostaje stały między świecami i zmienia się tylko, gdy nastawienie wyraźnie się przesuwa (co zapobiega ciągłemu przełączaniu).
Z czego składa się reżim. Każdy włączony interwał "głosuje" za każdym słupkiem na podstawie kierunku ceny, a głosy są łączone w jedną bieżącą wartość. Wolniejsze interwały i większe ruchy mają większą wagę. Ta łączona wartość jest następnie wygładzana na ostatnich słupkach. Wygładzony wynik jest jedyną wartością, która steruje zarówno kolorem słupków, jak i histogramem w §6, więc oba nigdy się nie różnią.
Histogramy
Ten sam wygładzony głos, który koloruje słupki, jest też rysowany jako histogram w własnym panelu wskaźnika poniżej ceny: zielone słupki powyżej środka, gdy netto nastawienie jest bycze, czerwone słupki poniżej, gdy niedźwiedzie, po jednym słupku na zamkniętą świecę (bieżący słupek aktualizuje się na żywo). Wyższe słupki oznaczają silniejsze nastawienie. Ponieważ jest to ta sama wartość, która stoi za kolorowaniem słupków, histogram i kolory świec zawsze się zgadzają. Sam w sobie jest przydatny do zauważania zaniku momentum — na przykład cena osiąga nowe maksimum, podczas gdy szczyty histogramu stają się niższe.
Poziomy odniesienia
Opcjonalnie wskaźnik rysuje płaskie poziome linie odniesienia, które podkreślają szczyty i dołki histogramu na obu panelach jednocześnie: linia w podpane znajduje się na ekstremum histogramu, a odpowiadająca jej linia na wykresie cenowym jest na tym samym słupku na maksimum (dla ekstremum górnego) lub minimum (dla ekstremum dolnego). Umieszczenie tych samych odniesień na obu panelach sprawia, że dywergencja jest łatwo zauważalna — na przykład cena drukuje nowe maksimum, podczas gdy odpowiadająca linia histogramu pokazuje, że mu to nie odpowiada.
Alerty dźwiękowe
Wskaźnik może dawać sygnały audio, dzięki czemu nie musisz patrzeć na panel. Są dwa niezależne źródła alertów i oba działają tylko wtedy, gdy panel pokazuje miernik presji (w układzie tylko miernik lub obok siebie) — alerty są oparte na odczycie miernika. Każde źródło ma własny przycisk włącz/wyłącz, a wspólny czas odnowienia zapobiega spamowi dźwięków na niestabilnym rynku.
Ładowanie i spójność
Przy włączonym Preload History wskaźnik odbudowuje niedawną historię podczas ładowania — kolorowanie świec, histogram, markery i poziomy odniesienia pojawiają się od razu, zamiast tworzyć się dopiero w czasie rzeczywistym. Max History Bars ustala, jak daleko wstecz ta rekonstrukcja sięga (dalej daje więcej kontekstu, ale ładuje się wolniej).
Odbudowana historia jest zbudowana tak, aby odpowiadać temu, co dałaby sesja na żywo.
Jak elementy współgrają ze sobą
- Szacowanie przepływu i interwały czasowe są fundamentem — wszystko inne odczytuje z nich.
- Tabela odczytów, miernik presji i linia werdyktu pokazują stan każdego interwału i pojedynczy łączny werdykt.
- Kolorowanie świec i histogram dzielą jeden wygładzony odczyt kierunku, więc zawsze się zgadzają.
- Markery pojawiają się, gdy kierunek się zmienia, przy zamknięciu świecy.
- Poziomy odniesienia oznaczają szczyty i dołki histogramu na obu panelach.
- Alerty dźwiękowe głosują miernik presji i łączny werdykt, dzięki czemu możesz odejść od ekranu.
Podsumowanie
The indicator features a draggable on-chart panel displaying a readings table per timeframe, a combined verdict line, and an optional buy/sell pressure meter. It offers bar coloring that tints price candles by prevailing directional regime (Bull, Bear, or Conflict), a histogram reflecting smoothed directional votes, markers indicating direction changes, and optional reference levels highlighting histogram extremes to aid divergence detection. Sound alerts provide audio cues based on pressure meter readings.
The indicator preloads recent history to present immediate, consistent data upon loading. It supports visualization, signals for divergences, breakouts, reversals, trend strength, volatility regimes, and level touches or breaks, requiring tick data input.








![Logo „Wyckoff Toolkit [Iridio Capital]”](https://cdn.ctrader.com/image/webp/5318c788-91ef-4297-bca6-4ce73b1516a8_61556)












