
Descripción
Indicador de Salida y Reingreso por Salto de Precio (PjER) es un indicador de gestión de riesgos basado en el artículo académico “Una estrategia dinámica de salida y reingreso por salto de precio para el trading intradía” de Koegelenberg & van Vuuren (2024), publicado en la revista Expert Systems With Applications.
Innovación Clave
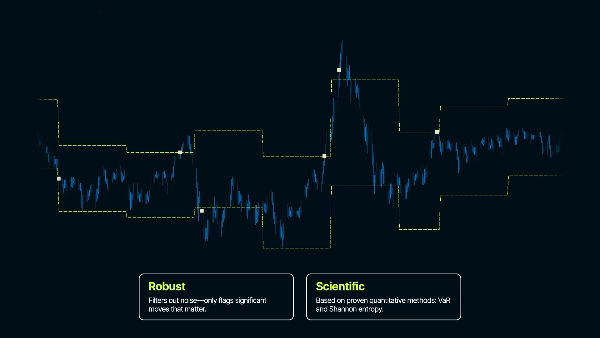
- Estimaciones VaR de pérdidas potenciales antes de que ocurran
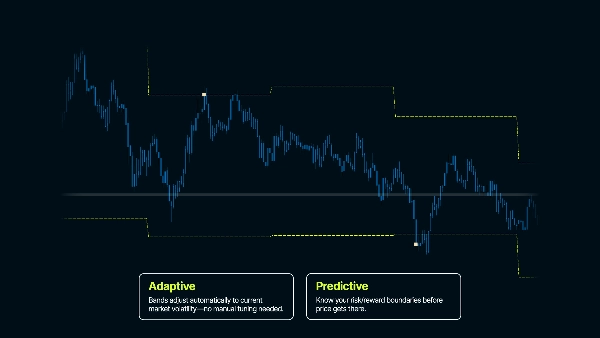
- Robustez frente a fuertes tendencias del mercado en marcos temporales cortos
- Análisis de corrección del mercado post-salto para un momento seguro de reingreso
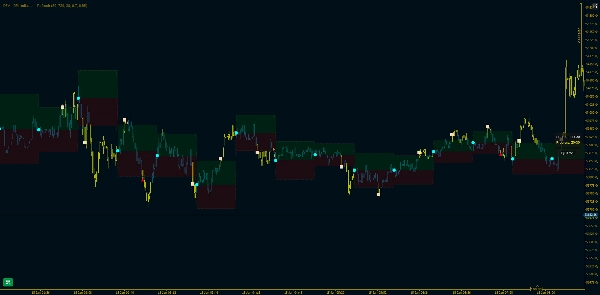
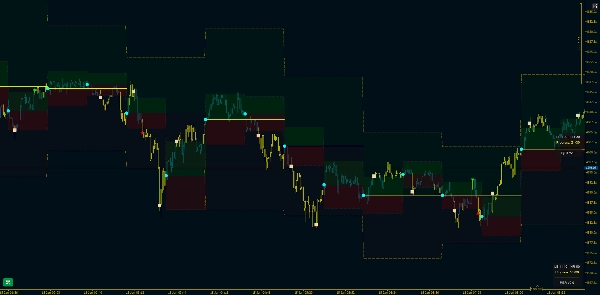
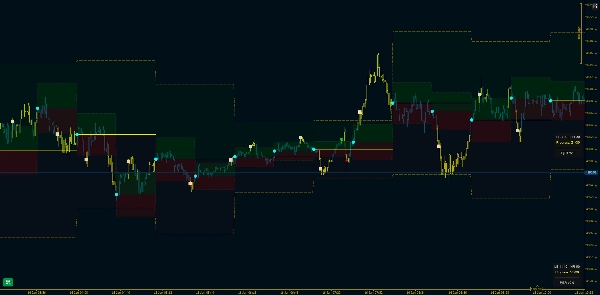
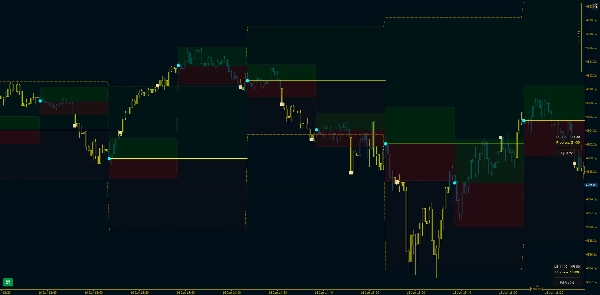
Analiza movimientos de precios pasados para entender la volatilidad típica y crea Intervalos de Confianza - que representan el rango de precios esperado. Cuando el precio salta fuera de estas bandas, señala que ocurrió algo anormal.
Caso de Uso Objetivo
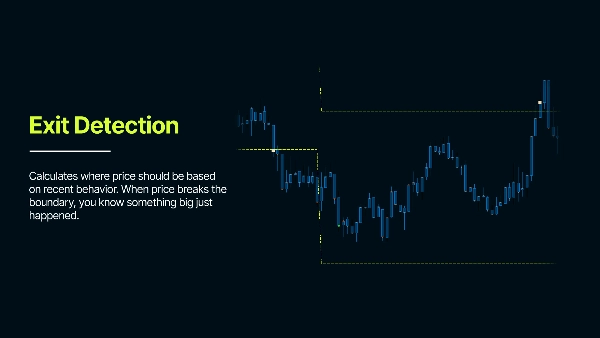
Trading intradía (especialmente estrategias basadas en rangos). Este indicador crea límites estadísticos alrededor del precio para detectar movimientos anormales. En un comportamiento normal del mercado, el precio se mantiene dentro de rangos esperados basados en la volatilidad reciente. Cuando el precio rompe estas bandas, indica que está ocurriendo algo inusual - un posible punto de salida de una operación o una ruptura en la estructura del mercado, porque el comportamiento del mercado ha cambiado.
Parámetros Principales Explicados
Días Máximos hacia Atrás - Determina cuán atrás en la historia comienza a funcionar el indicador
Desfase GMT - Ajusta para tu zona horaria. Asegura que los cálculos de fecha coincidan con tu hora local
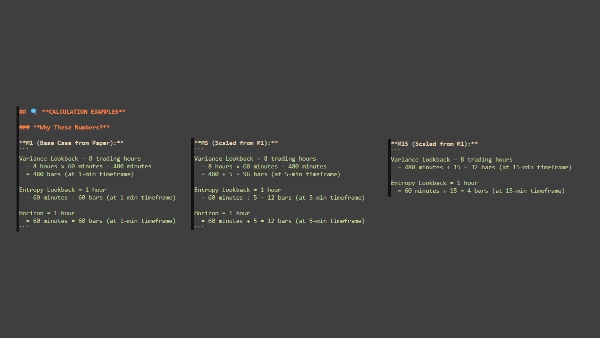
Periodo de Retrospectiva (barras)
"¿Cuánta historia de precios debo usar para medir el comportamiento 'normal'?"
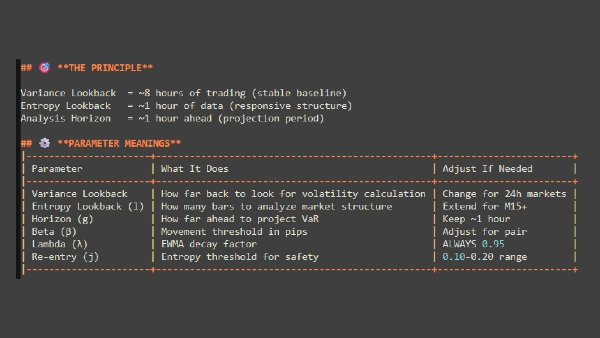
- Cuántas barras de datos históricos usar para calcular la volatilidad
- Más barras = más estable pero más lento para adaptarse; menos barras = reacción más rápida pero más ruido
- Ejemplo: 1440 barras en M1 = 24 horas de datos
Horizonte de Análisis (barras)
"¿Cuánto tiempo debo observar el precio antes de comenzar de nuevo?"
- Cuánto dura cada periodo de análisis antes de que las bandas se reinicien
- Define el marco temporal que estás analizando - más corto = reinicios más frecuentes, más largo = bandas permanecen fijas más tiempo
- Ejemplo: 60 barras = las bandas permanecen 60 barras, luego se recalculan desde un nuevo precio de referencia
Probabilidad de Riesgo
"¿Qué tan seguro quiero estar de que el precio normalmente no alcanzará estos niveles?"
- Establece el nivel de confianza para las bandas (como un margen de seguridad)
- Valores más altos = bandas más amplias (menos señales), valores más bajos = bandas más ajustadas (más señales)
- Ejemplo: 0.80 = 80% de confianza de que el precio se mantiene dentro de las bandas en condiciones normales
Factor de Decaimiento (λ - Lambda)
"¿Debería preocuparme más por lo que acaba de pasar o tratar toda la historia por igual?"
- Controla cuánto peso dar a los datos recientes frente a los antiguos en los cálculos de volatilidad
- Valores más altos = los datos recientes importan más; valores más bajos = todos los datos ponderados más equitativamente
- Ejemplo 0.95 = la volatilidad reciente influye fuertemente en el cálculo
PUNTOS CLAVE A RECORDAR
Esta es una herramienta de GESTIÓN DE RIESGOS – Identifica eventos de volatilidad y estabilidad durante períodos de tiempo
Los Intervalos de Confianza son críticos – Las bandas NO deben seguir el precio como ATR – Las bandas se calculan para cada periodo de análisis
El reingreso requiere paciencia – No esperes un reingreso instantáneo tras la salida – El mercado necesita tiempo para estabilizarse
Los parámetros son específicos para el activo y el marco temporal – Los parámetros por defecto son puntos de partida – Optimiza para tu mercado y estilo específico – Lo que funciona en FX puede no funcionar para Índices, Metales o Cripto.
( * ) Este indicador se proporciona únicamente con fines educativos e informativos. No está destinado como asesoramiento financiero o de inversión. Nada en este producto, su documentación o materiales relacionados debe interpretarse como una recomendación para comprar, vender o mantener cualquier instrumento financiero. Operar en mercados financieros implica un riesgo significativo y puede no ser adecuado para todos los inversores. El rendimiento pasado no es indicativo de resultados futuros. No hay garantía de ganancias y los usuarios pueden incurrir en pérdidas sustanciales. Al usar este indicador, reconoces que eres el único responsable de tus decisiones de trading y resultados financieros. El creador de este producto no será responsable por pérdidas o daños que surjan directa o indirectamente de su uso. Siempre realiza tu propio análisis antes de tomar cualquier decisión de trading.
Resumen
Key features include Value at Risk (VaR) estimates to anticipate potential losses, robustness against strong short-term trends, and analysis of post-jump corrections to identify safe re-entry timings. Core adjustable parameters allow users to tailor the indicator to specific assets and timeframes, including lookback period for volatility calculation, analysis horizon for band recalculation frequency, risk probability to set confidence levels, and decay factor to weight recent versus older data.
The indicator emphasizes patience for re-entry after exits, as market stabilization is required. It is intended as a tool for identifying volatility events and managing risk rather than providing direct trade signals. Users should optimize parameters according to their trading style and market conditions.
Valoraciones de clientes
5 | 100 % | |
4 | 0 % | |
3 | 0 % | |
2 | 0 % | |
1 | 0 % |


