
Descripción
Zonas de Liquidez en el Mapa de Calor
Visualiza el volumen por precio, descubre soportes/resistencias ocultos y sigue la liquidez del mercado en tiempo real.
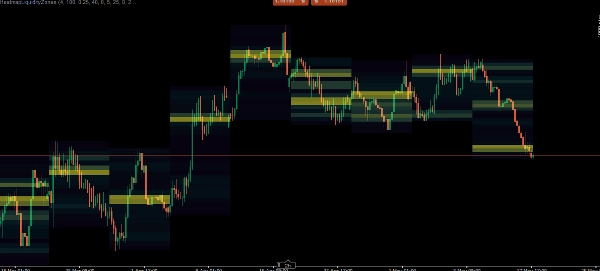
El indicador Zonas de Liquidez en el Mapa de Calor es una herramienta poderosa de perfilado de volumen que traduce datos brutos del mercado en un mapa de calor visual intuitivo. Al analizar el volumen de ticks en marcos temporales superiores específicos (HTF), identifica exactamente dónde se concentra la presión de compra y venta más significativa.
En lugar de adivinar dónde podría revertir el mercado, este indicador traza niveles precisos de liquidez respaldados por volumen. Estos niveles se extienden hacia adelante de forma dinámica y desaparecen automáticamente una vez que el precio los rompe e invalida, manteniendo tu gráfico limpio y estrictamente relevante para la acción actual del precio.
Características Clave
Mapa de Calor Multitemporal: Selecciona tu marco temporal macro preferido (1H, 4H, Diario, Semanal o Mensual). El indicador mapeará la distribución del volumen para ese período específico directamente en tus gráficos de marcos temporales inferiores.
Segmentación Dinámica ATR: La escala de precios se divide en "segmentos" (zonas) dinámicos calculados usando el Rango Verdadero Promedio (ATR). Esto asegura que el mapa de calor se adapte inteligentemente tanto a mercados altamente volátiles como a mercados en consolidación estrecha.
Niveles de Liquidez que se Invalidan Automáticamente: Cuando un segmento de precio específico acumula una gran cantidad de volumen, se convierte en un "Nivel de Liquidez". El indicador dibuja una línea sólida que se extiende hacia el futuro. Si el precio rompe con éxito este nivel, la línea se elimina automáticamente (se invalida).
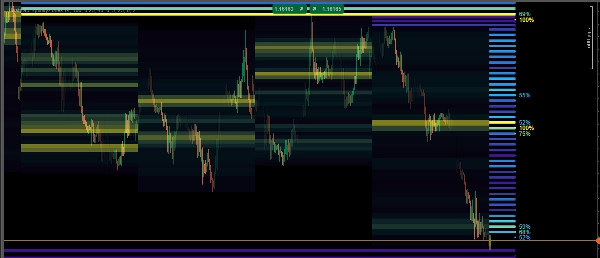
Coloreado por Gradiente de Densidad: Distingue visualmente entre nodos de volumen Bajo, Medio y Alto. El mapa de calor usa un gradiente de color para mostrarte exactamente dónde está atrapado el volumen más pesado.
Seguimiento Porcentual: Los niveles de liquidez de alta densidad muestran una etiqueta porcentual (por ejemplo, 85%), mostrando exactamente qué tan fuerte es ese nodo en relación con el volumen del resto del período HTF.
Resumen
The indicator segments the price scale into dynamic zones based on the Average True Range (ATR), adapting to market volatility. It highlights significant volume clusters as liquidity levels with solid lines extending forward. These lines automatically disappear if the price breaks through the level, ensuring the chart remains focused on relevant, current price action.
A color gradient visually distinguishes low, medium, and high volume nodes, while percentage labels indicate the relative strength of high-density liquidity levels within the chosen timeframe. This tool supports traders in tracking market liquidity in real-time and making volume-backed decisions regarding support and resistance areas.
Valoraciones de clientes
5 | 100 % | |
4 | 0 % | |
3 | 0 % | |
2 | 0 % | |
1 | 0 % |


![Logotipo de "[Stellar Strategies] Inside Bar with Signals"](https://cdn.ctrader.com/image/webp/1d9e8bfa-3b2c-4440-bb37-5856902008a7_30683)


