
Descripción
Volume Bubbles – Indicador personalizado de cTrader
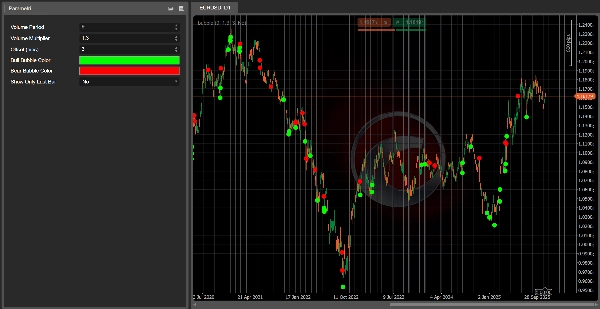
Volume Bubbles es un indicador visual ligero pero potente para cTrader que resalta las velas con volumen excepcional directamente en el gráfico de precios.
En lugar de mirar el histograma de volumen y tratar de adivinar qué barras realmente importan, esta herramienta detecta automáticamente cuando el volumen de la vela actual es significativamente mayor que el promedio reciente y dibuja una burbuja (icono de círculo) en esa barra:
- Para velas alcistas, se dibuja una burbuja debajo del mínimo de la vela.
- Para velas bajistas, se dibuja una burbuja encima del máximo de la vela.
Esto hace que sea extremadamente fácil identificar posibles movimientos climáticos, áreas de fuerte interés por parte de grandes jugadores o posibles puntos de agotamiento en la tendencia.
Características clave
- ✅ Detecta velas de alto volumen usando un Promedio Móvil del volumen de ticks
- ✅ Dibuja burbujas claras en el gráfico (no se necesita ventana secundaria adicional)
- ✅ Colores diferentes para picos de volumen alcistas y bajistas
- ✅ Desplazamiento ajustable en pips para posicionar las burbujas alejadas de la vela
- ✅ Opción para mostrar burbujas solo en la barra más reciente (para trading en tiempo real)
Entradas / Parámetros
- Período de Volumen – Número de barras usadas para el promedio móvil de volumen.
- Multiplicador de Volumen – Cuántas veces por encima del volumen promedio debe estar una barra para activar una burbuja.
- Desplazamiento (pips) – Distancia entre la burbuja y el máximo/mínimo de la vela.
- Color de Burbuja Alcista – Color de las burbujas en velas alcistas.
- Color de Burbuja Bajista – Color de las burbujas en velas bajistas.
- Mostrar Solo Última Barra – Si es verdadero, muestra burbujas solo en la barra actual en vivo.
Cómo usar
Agrega Volume Bubbles a tu gráfico y úsalo como un filtro visual para:
- Confirmar rupturas respaldadas por volumen fuerte
- Detectar posibles reversiones o velas de agotamiento
- Identificar zonas donde grandes jugadores pueden estar activos
No es un sistema de trading independiente, pero es una excelente herramienta complementaria para cualquier estrategia de acción del precio o seguimiento de tendencia que valore el volumen.
👉 Únete aquí: Algotrendit Volume Bubbles
Dentro del servidor encontrarás:
- Soporte para este y otros cBots/indicadores
- Discusión de estrategias e ideas de optimización
- Actualizaciones, noticias y futuras herramientas que lance
Resumen
Key features include adjustable parameters such as the volume period for averaging, volume multiplier threshold, bubble offset in pips, and customizable colors for bullish and bearish volume spikes. Users can also choose to display bubbles only on the latest bar for real-time trading. The indicator integrates directly on the price chart without requiring additional subwindows.
Volume Bubbles serves as a visual filter to confirm breakouts supported by strong volume, spot possible reversals or exhaustion candles, and identify zones of significant market activity. It complements price action and trend-following strategies by providing volume-based insights across various markets including forex, indices, commodities, stocks, and cryptocurrencies.
Valoraciones de clientes
5 | 0 % | |
4 | 100 % | |
3 | 0 % | |
2 | 0 % | |
1 | 0 % |


