
Liquidity Shift Indicator
Indicador
691 descargas
Versión 1.0, Dec 2025
Windows, Mac
5.0
Valoraciones: 1

Descripción
Indicador de Cambio de Liquidez – Herramienta de Estructura de Mercado y Liquidez
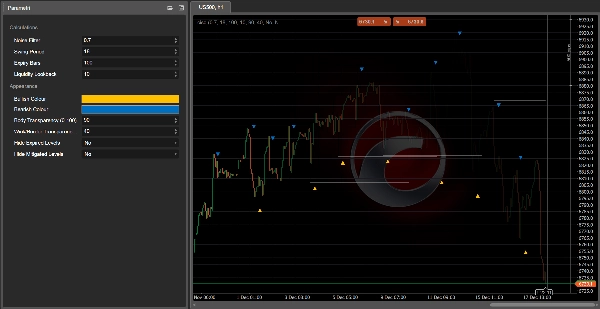
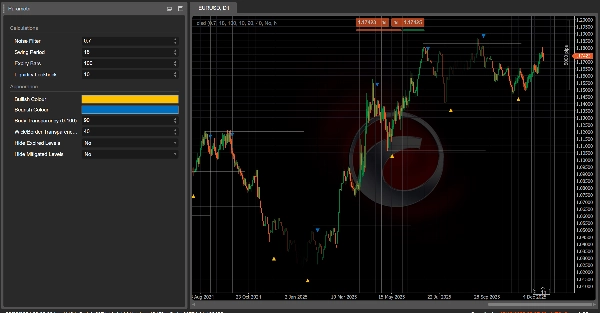
El Indicador de Cambio de Liquidez identifica niveles de liquidez de máximos y mínimos oscilantes y detecta eventos CISD (Cambio en el Estado de Entrega), que a menudo señalan un cambio en la intención del mercado después de que el precio interactúa con la liquidez.
Características Clave
- Traza automáticamente niveles de liquidez basados en máximos y mínimos oscilantes.
- Rastrea cuando los niveles de liquidez son mitigados (barridos/tocados) y puede ocultarlos opcionalmente para un gráfico más limpio.
- Detecta condiciones CISD alcistas y bajistas usando cambios en el estado de las velas y un Filtro de Ruido configurable para reducir señales falsas.
- Resalta señales CISD fuertes cuando ocurre un CISD poco después de un barrido de liquidez opuesto (basado en la configuración de Revisión de Liquidez).
- Ayuda a los traders a detectar barridos de liquidez, cambios de estructura, posibles reversiones y configuraciones de continuación.
Entradas Personalizables
- Filtro de Ruido (controla la sensibilidad y reduce el ruido)
- Periodo de Oscilación (define cómo se detectan los puntos de oscilación)
- Barras de Expiración (cuánto tiempo permanecen activos los niveles de liquidez)
- Revisión de Liquidez (qué tan reciente debe ser un barrido para calificar como señal “fuerte”)
- Opciones para ocultar niveles expirados y/o mitigados
Nota
El Indicador de Cambio de Liquidez está diseñado para análisis y confirmación. Siempre combínelo con una gestión adecuada del riesgo y contexto adicional del mercado (tendencia, volatilidad, niveles de marcos temporales superiores).
¿Quieres un cBot basado en este indicador? ¡Contáctanos!
Resumen
Resumen de IA
The Liquidity Shift Indicator is a market structure and liquidity analysis tool designed to identify swing-high and swing-low liquidity levels. It detects Change in State of Delivery (CISD) events, which often indicate shifts in market intent following price interactions with liquidity. The indicator automatically plots liquidity levels based on swing points and tracks when these levels are mitigated (swept or touched), with options to hide mitigated or expired levels for clearer charts.
Key functionalities include detection of bullish and bearish CISD conditions using candle state changes combined with a configurable Noise Filter to minimize false signals. It highlights strong CISD signals that occur shortly after opposing liquidity sweeps, aiding traders in spotting liquidity sweeps, structural shifts, potential reversals, and continuation setups.
Customizable inputs allow adjustment of Noise Filter sensitivity, Swing Period for swing point detection, Expiry Bars defining liquidity level duration, and Liquidity Lookback to qualify strong signals. The indicator is intended for analysis and confirmation and should be used alongside proper risk management and additional market context such as trend, volatility, and higher-timeframe levels. It supports various markets including Forex, indices, commodities, stocks, and cryptocurrencies.
Perfil del indicador
Valoraciones de clientes
5.0
Valoraciones: 1
5 | 100 % | |
4 | 0 % | |
3 | 0 % | |
2 | 0 % | |
1 | 0 % |
Valoraciones de clientes
December 22, 2025
Liquidity Shift Indicator highlights moments when market balance changes after liquidity runs. Great for SMC traders looking for early trend shifts and impulse confirmation. Clean, stable and best used with structure and FVG context.
Conversación
Preguntas frecuentes
Signal
Indices
Commodities
GBPUSD
RSI
Bollinger
Fibonacci
Scalping
AI
XAUUSD
NAS100
MACD
BTCUSD
Forex
Breakout
EURUSD
NZDUSD
Martingale
Prop
ZigZag
Supertrend
Fair Value Gap
SMC
Crypto
Grid
Stocks
ATR
USDJPY
VWAP
Los productos disponibles a través de cTrader Store, incluidos bots, indicadores y plugins para operar, son proporcionados por desarrolladores de terceros y están disponibles únicamente con fines informativos y de acceso técnico. cTrader Store no es un bróker, por lo que no proporciona asesoramiento de inversión, recomendaciones personales ni ninguna garantía de rentabilidad futura.


Precio
42.11M
Volumen operado
6.13M
Pips ganados
228
Ventas
8.48K
Instalaciones gratis