
Breakout channel
Indicador
523 descargas
Versión 1.0, Nov 2025
Windows, Mac
Descripción
Canales de ruptura
Qué hace
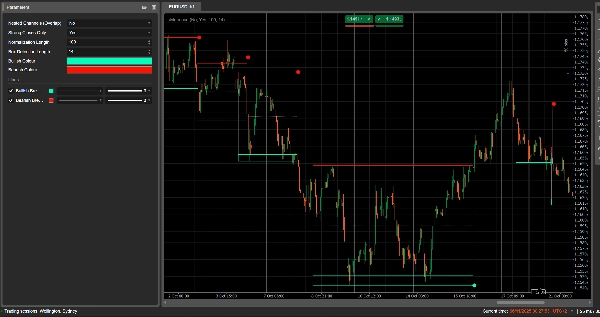
Canales de ruptura detecta automáticamente rangos de consolidación (”cajas” de precio) y marca puntos de ruptura cuando el precio escapa de esos rangos.
Dibuja:
- Una caja de canal gris alrededor de la zona de consolidación
- Una banda superior roja (resistencia potencial)
- Una banda inferior verde (soporte potencial)
- Una línea media punteada blanca (punto medio del canal)
- Puntos coloreados cuando ocurre una ruptura:
-
- Punto verde/cian debajo de la caja → ruptura alcista
- Punto rojo encima de la caja → ruptura bajista
La idea es resaltar visualmente áreas donde el precio está acumulándose y donde es probable que comiencen movimientos fuertes cuando se rompa el rango.
Cómo se calcula
- Normalización del precio
-
- Durante las últimas Normalization Length barras encuentra el máximo más alto y el mínimo más bajo.
- Normaliza el cierre en un rango 0–1:
normalizedPrice=Close−LowestLowHighestHigh−LowestLow\text{normalizedPrice} = \frac{\text{Close} - \text{LowestLow}}{\text{HighestHigh} - \text{LowestLow}}normalizedPrice=HighestHigh−LowestLowClose−LowestLow
- Medida de volatilidad
-
- Calcula la desviación estándar del precio normalizado durante 14 barras.
- Esto genera una serie de volatilidad usada para detectar puntos de giro en la estructura del mercado.
- Líneas de “volatilidad” superior / inferior
-
- Durante las últimas (Box Detection Length + 1) barras, encuentra:
-
- la barra donde la volatilidad fue más alta
- la barra donde la volatilidad fue más baja
- A partir de cuántas barras atrás ocurrieron estos extremos, construye dos líneas sintéticas: Superior e Inferior.
- Los cruces entre estas líneas señalan inicio/fin potencial de una fase de canal.
- Inicio y duración del canal
-
- Cuando Inferior cruza por encima de Superior, el indicador marca un inicio potencial del canal.
- Desde esa barra rastrea la duración y el máximo más alto / mínimo más bajo en el periodo.
- Creación del canal
-
- Cuando más tarde Superior cruza de nuevo por encima de Inferior, y la duración es mayor a 10 barras:
-
- Define el Tope del canal como el máximo más alto en ese periodo.
- Define el Fondo del canal como el mínimo más bajo.
- Mide el actual ATR/2 para separar una zona delgada en la parte superior e inferior:
-
- Banda roja en la parte superior (banda bajista)
- Banda verde en la parte inferior (banda alcista)
- Dibuja:
-
- Rectángulo de contorno gris (canal completo)
- Contorno superior rojo
- Contorno inferior verde
- Una línea media punteada blanca a través del centro
- Los canales permanecen en el gráfico como estructura histórica (no se eliminan después de la ruptura).
- Detección de ruptura
-
- Para cada canal activo, en cada nueva barra calcula un precio de referencia:
-
- Si Strong Closes Only = true → usa el punto medio del cuerpo de la vela:
refPrice=(Open+Close)/2\text{refPrice} = (\text{Open} + \text{Close})/2refPrice=(Open+Close)/2
Esto requiere que más de la mitad del cuerpo esté fuera de la caja. - Si Strong Closes Only = false → usa el simple Cierre.
- Si Strong Closes Only = true → usa el punto medio del cuerpo de la vela:
- Reglas de ruptura:
-
- Si
refPrice > Top→ ruptura alcista -
- Dibuja un punto verde en el Fondo del canal.
- Desactiva este canal (deja de extenderlo), pero la caja permanece visible.
- Si
refPrice < Bottom→ ruptura bajista -
- Dibuja un punto rojo en el Tope del canal.
- Desactiva el canal.
- De lo contrario, el canal sigue activo y su borde derecho se extiende hasta la barra actual.
- Si
- Opción de canales anidados
-
- Si Nested Channels = true, múltiples canales pueden superponerse en tiempo y precio.
- Si false, el indicador bloquea la creación de un nuevo canal que se superpondría con uno existente.
Cómo leerlo y usarlo
- Caja gris (canal)
-
- Representa una zona de consolidación / equilibrio donde el precio ha estado operando por un tiempo.
- Cuanto más larga y alta es la caja, más significativo es el rango.
- Banda superior roja (zona de resistencia)
-
- La parte superior del canal, visualmente enfatizada como una zona de resistencia potencial.
- Rechazos repetidos cerca de esta banda sugieren presión de venta dentro del rango.
- Banda inferior verde (zona de soporte)
-
- La parte inferior del canal, destacada como soporte potencial.
- Rebotes repetidos sugieren compradores defendiendo el borde inferior del rango.
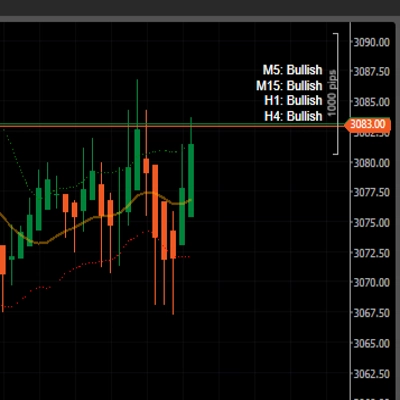
- Línea media punteada blanca
-
- El punto medio del canal – una especie de “valor justo” local.
- El precio oscilando alrededor de esta línea indica equilibrio; movimientos fuertes alejándose a menudo preceden una prueba de la banda opuesta.
- Puntos de ruptura
-
- Punto verde debajo de la caja:
-
- El precio ha cerrado fuertemente por encima de la parte superior del canal (o simplemente cerrado por encima, dependiendo de Strong Closes Only).
- Sugiere una ruptura alcista – inicio potencial de un movimiento alcista tras una compresión de volatilidad.
- Punto rojo encima de la caja:
-
- El precio ha cerrado fuertemente por debajo de la parte inferior del canal.
- Sugiere una ruptura bajista – inicio potencial de un movimiento bajista.
- Formas típicas de usarlo (a nivel de idea)
-
- Rupturas siguiendo la tendencia
-
- Operar en la dirección de la ruptura (comprar tras punto verde, vender tras punto rojo), idealmente en confluencia con la tendencia de un marco temporal superior u otros indicadores.
- Filtro y confirmación
-
- Usar el canal y su ruptura solo como un filtro para tu estrategia existente (por ejemplo, solo tomar configuraciones largas si la última señal fue una ruptura alcista).
- Colocación del riesgo
-
- Para rupturas alcistas, muchos traders colocan stops dentro o justo debajo del canal anterior; para rupturas bajistas, dentro o por encima de la caja.
Resumen
Resumen de IA
Breakout Channels is a technical indicator designed to identify consolidation zones and signal potential price breakouts. It automatically detects price ranges where the market is coiling, marking these with a grey channel box that highlights the consolidation area. The indicator draws a red upper band indicating potential resistance, a green lower band indicating potential support, and a white dotted midline representing the channel midpoint or local fair value.
Breakout points are signaled by colored dots: a green or cyan dot below the box indicates a bullish breakout, while a red dot above signals a bearish breakout. The indicator calculates these zones by normalizing price data, measuring volatility through the standard deviation of normalized prices, and identifying volatility extremes to define channel start and duration.
Channels remain visible on the chart as historical structures even after breakouts. Users can enable nested channels to allow overlapping consolidation zones. Breakout detection uses either candle body midpoints or close prices, depending on settings, to confirm strong closes outside the channel.
Typical uses include trading in the breakout direction, filtering existing strategies, and placing risk stops near channel boundaries. The indicator supports various markets including forex, indices, commodities, stocks, and cryptocurrencies.
Perfil del indicador
Valoraciones de clientes
0.0
Valoraciones: 0
Valoraciones de clientes
Este producto todavía no se ha valorado. ¿Ya lo ha probado? Sea el primero en informar a otros.
Conversación
Preguntas frecuentes
Signal
Indices
Commodities
GBPUSD
RSI
Bollinger
Fibonacci
Scalping
AI
XAUUSD
NAS100
MACD
BTCUSD
Forex
Breakout
EURUSD
NZDUSD
Martingale
Prop
ZigZag
Supertrend
Fair Value Gap
SMC
Crypto
Grid
Stocks
ATR
USDJPY
VWAP
Los productos disponibles a través de cTrader Store, incluidos bots, indicadores y plugins para operar, son proporcionados por desarrolladores de terceros y están disponibles únicamente con fines informativos y de acceso técnico. cTrader Store no es un bróker, por lo que no proporciona asesoramiento de inversión, recomendaciones personales ni ninguna garantía de rentabilidad futura.


Precio
42.11M
Volumen operado
6.13M
Pips ganados
228
Ventas
8.48K
Instalaciones gratis