
Descripción
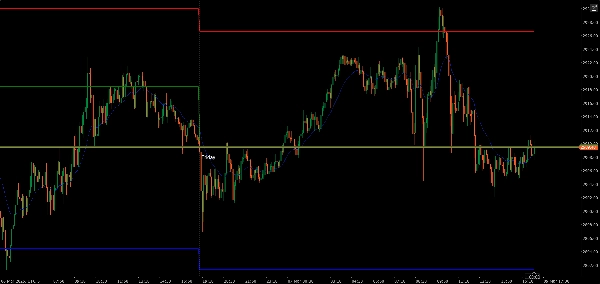
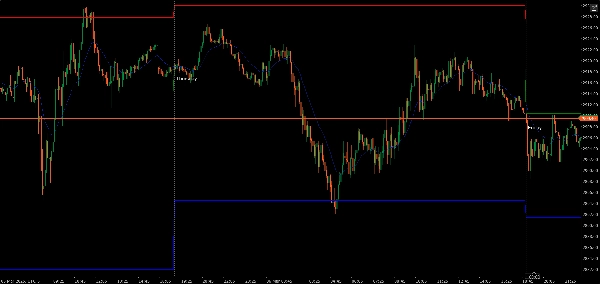
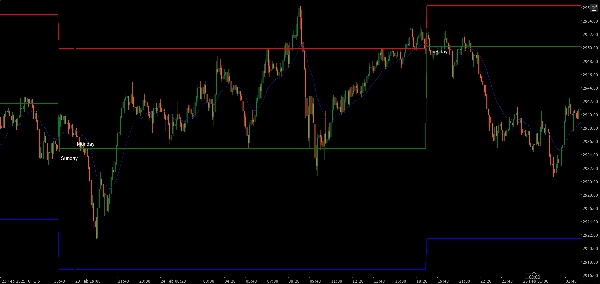
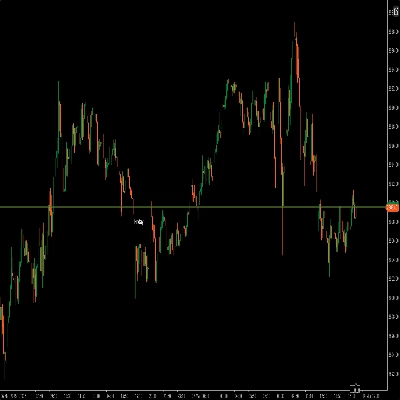
indicador de máximo, mínimo y cierre del día anterior.
la línea azul muestra el mínimo del día anterior.
la línea roja muestra el máximo del día anterior.
la línea verde muestra el cierre del día anterior.
Resumen
Resumen de IA
The trPDHLC indicator displays the previous day's high, low, and closing prices on a trading chart. It uses color-coded lines for clear visualization: a red line marks the previous day's high, a blue line indicates the previous day's low, and a green line shows the previous day's closing price. This tool helps traders quickly reference key price levels from the prior trading day, aiding in technical analysis and decision-making. The indicator is tagged for use with indices markets.
Perfil del indicador
Valoraciones de clientes
0.0
Valoraciones: 0
Valoraciones de clientes
Este producto todavía no se ha valorado. ¿Ya lo ha probado? Sea el primero en informar a otros.
Conversación
Preguntas frecuentes
Indices
Los productos disponibles a través de cTrader Store, incluidos bots, indicadores y plugins para operar, son proporcionados por desarrolladores de terceros y están disponibles únicamente con fines informativos y de acceso técnico. cTrader Store no es un bróker, por lo que no proporciona asesoramiento de inversión, recomendaciones personales ni ninguna garantía de rentabilidad futura.
Más de este autor


Precio
Desde 08/03/2025
1
Ventas