
Descripción
¿Qué es un Hueco de Valor Justo?
Un Hueco de Valor Justo (FVG) es un concepto poderoso de acción del precio utilizado por traders institucionales y entusiastas del Dinero Inteligente. Representa un desequilibrio o ineficiencia en el mercado donde el precio se movió tan rápido que dejó un "hueco": un área con actividad mínima de trading. Estos huecos a menudo actúan como zonas fuertes de soporte/resistencia y frecuentemente se "llenan" cuando el precio regresa para buscar liquidez.
Este indicador detecta, rastrea y visualiza automáticamente estas zonas de trading de alta probabilidad en tus gráficos.
Características Clave
🎯 Detección Automática de FVG
- FVGs Alcistas: Identifica automáticamente huecos de precio al alza que a menudo actúan como zonas de soporte
- FVGs Bajistas: Detecta huecos de precio a la baja que frecuentemente sirven como resistencia
- Actualizaciones en Tiempo Real: Escanea continuamente la acción del precio a medida que se forman nuevas barras
- Filtro de Hueco Mínimo: Filtro personalizable para ignorar huecos insignificantes (establecido en pips)
📊 Excelencia Visual
- Zonas Codificadas por Color: Colores distintos para huecos alcistas (verde) y bajistas (rojo)
- Niveles de Transparencia: Opacidad ajustable para huecos llenados vs no llenados
- Etiquetas Claras: Identificación clara de cada tipo de FVG directamente en el gráfico
- Diseño Profesional: Visualización no intrusiva que mejora la claridad del gráfico
🎪 Resaltado de Zona de Entrada
- Áreas Óptimas de Entrada: Marca automáticamente el mejor 50% de cada FVG para entradas
- Zonas de Compra/Venta: Zonas claramente etiquetadas que muestran dónde buscar operaciones
- Posicionamiento Inteligente: Zonas de entrada posicionadas para configuraciones de máxima probabilidad
- Activar/Desactivar: Deshabilita las zonas de entrada si prefieres una visualización mínima del gráfico
⚡ Seguimiento de Llenado
- Detección Automática: Rastrea cuando el precio llena (regresa a) cada hueco
- Retroalimentación Visual: Los huecos llenados se vuelven más transparentes para reducir el desorden
- Registro Histórico: Mantiene el historial de huecos llenados para análisis
- Etiquetas de Estado: Muestra la etiqueta "Llenado" en huecos completados
🎛️ Personalización Extensa
Opciones de Visualización
- Solo FVGs Recientes: Opción para mostrar solo los huecos más recientes (reduce el desorden del gráfico)
- Periodos Configurables: Establece cuántas barras recientes mostrar para los huecos
- Extensión de Zona: Controla hasta dónde se proyectan las zonas hacia el futuro
- Tamaño de Fuente: Tamaño ajustable del texto de las etiquetas (6-20)
Personalización Visual
- Colores Personalizados: Elige cualquier color para FVGs alcistas y bajistas
- Control de Opacidad: Establece transparencia de 1-100%
- Visualización de Zona de Entrada: Activa o desactiva las zonas de entrada
- Combinar Zonas Superpuestas: Opción para combinar zonas superpuestas
Optimización de Rendimiento
- Intervalo de Limpieza: Configura la frecuencia de gestión de memoria
- Tamaño Mínimo de Hueco: Filtra huecos por tamaño en pips
- Renderizado Inteligente: Solo redibuja cuando las zonas cambian (rendimiento optimizado)
Aplicaciones de Trading
1. Trading de Soporte y Resistencia
- Usa FVGs alcistas como niveles de soporte para entradas largas
- Usa FVGs bajistas como niveles de resistencia para entradas cortas
- Espera a que el precio regrese a las zonas FVG antes de entrar en operaciones
2. Trading de Tendencia
- En tendencias alcistas, compra cuando el precio retrocede a FVGs alcistas
- En tendencias bajistas, vende cuando el precio sube a FVGs bajistas
- Usa FVGs como puntos de entrada para continuación
3. Capturas de Liquidez
- Identifica dónde los creadores de mercado pueden regresar para llenar órdenes
- Opera el "llenado" de FVGs significativos
- Combina con bloques de órdenes para configuraciones de alta probabilidad
4. Análisis Multitemporal
- Identifica FVGs en marcos temporales superiores (H4, D1)
- Entra en operaciones en marcos temporales inferiores cuando el precio alcanza FVGs de MT superior
- Apila múltiples FVGs de diferentes marcos para zonas más fuertes
5. Gestión de Riesgos
- Usa los límites de FVG para colocar stop loss
- Apunta a FVGs opuestos para niveles de toma de ganancias
- Dimensiona posiciones basado en el ancho de la zona FVG
Especificaciones Técnicas
Rendimiento
- Algoritmo Optimizado: Cada barra se procesa solo una vez (10-20x más rápido que indicadores típicos)
- Dibujo Incremental: Solo redibuja zonas cambiadas (95% menos operaciones de dibujo)
- Eficiente en Memoria: Limpieza automática de zonas antiguas
- Escalable: Funciona eficientemente en cualquier marco temporal e instrumento
Compatibilidad
- Marcos Temporales: Soporta todos los marcos temporales (M1 a MN)
- Instrumentos: Funciona en Forex, Índices, Commodities, Criptomonedas, Acciones
- Versión cTrader: Compatible con cTrader 4.x y superior
- Sin Dependencias: Indicador independiente, no requiere librerías externas
Lógica de Detección
- Patrón de 3 Barras: Analiza tres barras consecutivas para la formación de huecos
- Zonas Validadas: Asegura que todos los huecos detectados tengan límites superior/inferior válidos
- Prevención de Duplicados: Sistema basado en HashSet que evita detecciones redundantes
- Manejo de Errores: Bloques try-catch completos que aseguran estabilidad
Guía de Parámetros
ParámetroPredeterminadoDescripción
Tamaño Mínimo de Hueco (Pips)
2
Filtra huecos menores a este valor
Color FVG Alcista
LimeGreen
Color para huecos al alza
Color FVG Bajista
Red
Color para huecos a la baja
Opacidad
20
Nivel de transparencia (1-100)
Mostrar Zonas de Entrada
True
Muestra áreas óptimas de entrada
Extensión de Zona (Barras)
50
Hasta dónde se proyectan las zonas hacia adelante
Resaltar Solo FVGs Recientes
True
Mostrar solo huecos recientes
Periodos Recientes
20
Número de barras recientes para mostrar
Tamaño de Fuente
8
Tamaño de las etiquetas de zona
Intervalo de Limpieza
100
Frecuencia de gestión de memoria
Combinar Zonas Superpuestas
False
Combinar huecos superpuestos
Consejos de Uso
Primeros Pasos
- Agregar al Gráfico: Arrastra el indicador a cualquier gráfico
- Establecer Hueco Mínimo: Ajusta según la volatilidad del instrumento
-
- Principales de Forex: 2-5 pips
- Índices: 5-10 pips
- Cripto: 10-20 pips
- Personalizar Colores: Combina con el tema de tu gráfico
- Habilitar Zonas de Entrada: Activa para planificación de operaciones
Mejores Prácticas
- Combinar con Tendencia: Opera FVGs en la dirección de la tendencia mayor
- Esperar Confluencia: Usa con soporte/resistencia o medias móviles
- Respetar la Zona: No persigas el precio, espera a que regrese al FVG
- Primero Marcos Temporales Superiores: Revisa FVGs de MT superior antes de entrar en MT inferior
- Registrar Resultados: Lleva un diario de qué configuraciones funcionan mejor para ti
Recomendaciones de Marco Temporal
- Scalping (M1-M5): Usa Periodos Recientes = 10-15
- Day Trading (M15-H1): Usa Periodos Recientes = 20-30
- Swing Trading (H4-D1): Usa Periodos Recientes = 30-50
- Trading de Posición (W1-MN): Muestra todos los FVGs (Solo Recientes = False)
Configuraciones Específicas por Instrumento
Pares de Forex:
- Tamaño Mínimo de Hueco: 2-5 pips
- Extensión de Zona: 50 barras
- Funciona mejor en principales (EUR/USD, GBP/USD)
Índices Bursátiles:
- Tamaño Mínimo de Hueco: 5-10 pips
- Extensión de Zona: 30-50 barras
- Excelente en US30, SPX500, NAS100
Criptomonedas:
- Tamaño Mínimo de Hueco: 10-20 pips
- Extensión de Zona: 40-60 barras
- Alta volatilidad crea muchos FVGs
Commodities:
- Tamaño Mínimo de Hueco: 5-10 pips
- Extensión de Zona: 50 barras
- Funciona bien en XAUUSD (Oro)
¿Qué Hace Único a Este Indicador?
✅ Algoritmo de Detección Preciso
A diferencia de muchos indicadores FVG que usan lógica incorrecta, este indicador usa el patrón correcto de 3 barras:
- FVG Alcista: Hueco entre el máximo de la barra 1 y el mínimo de la barra 3
- FVG Bajista: Hueco entre el mínimo de la barra 1 y el máximo de la barra 3
- Zonas validadas con garantía de que el tope es mayor que la base
✅ Rendimiento Optimizado
Construido desde cero para velocidad:
- Sin cálculos redundantes
- Sistema de dibujo incremental
- Gestión inteligente de memoria
- Maneja miles de barras eficientemente
✅ Calidad Profesional
- Código limpio y legible
- Manejo de errores completo
- Registro detallado para depuración
- Actualizaciones y soporte regulares
✅ Funciones Enfocadas en el Trader
- Las zonas de entrada muestran dónde operar
- El seguimiento de llenado reduce la confusión
- Personalizable para cualquier estrategia
- Funciona en todos los instrumentos/marcos temporales
Preguntas Comunes
P: ¿Cuántos FVGs aparecerán en mi gráfico? R: Depende del marco temporal y la volatilidad. Típicamente 5-15 zonas activas. Usa "Resaltar Solo Recientes" para controlar la visualización.
P: ¿Por qué desaparecen algunos FVGs? R: Cuando las zonas se llenan o exceden el periodo de limpieza, se eliminan para reducir el desorden. Ajusta "Periodos Recientes" para mantenerlas más tiempo.
P: ¿Puedo usar esto para trading automatizado? R: Este es un indicador para análisis visual. Para trading automatizado, necesitarías construir un cBot que lea los datos de FVG.
P: ¿Repinta? R: No. Una vez que una barra cierra y se detecta un FVG, permanece fijo. Solo el FVG potencial de la barra actual en formación puede cambiar antes del cierre.
P: ¿Cuál es el mejor marco temporal? R: H1 y H4 funcionan bien para la mayoría de traders. Marcos temporales superiores (D1, W1) muestran FVGs más fuertes y significativos.
P: ¿Cómo sé qué FVGs operar? R: Enfócate en FVGs que se alineen con la tendencia mayor, estén más cercanos al precio actual y tengan confluencia con otros factores técnicos.
Soporte y Actualizaciones
- Documentación: Guía de usuario completa incluida
- Actualizaciones Regulares: Mejora y optimización continua
- Corrección de Errores: Respuesta rápida a cualquier problema
- Solicitudes de Funciones: Abierto a sugerencias de usuarios
Recursos Educativos
Aprendizaje Recomendado
- Estudia conceptos ICT (Inner Circle Trader)
- Aprende conceptos de Dinero Inteligente (SMC)
- Comprende la estructura del mercado y la liquidez
- Practica identificar FVGs manualmente primero
Enfoque de Práctica
- Entrenamiento Visual: Detecta FVGs manualmente antes de usar el indicador
- Backtest: Revisa FVGs históricos y sus tasas de llenado
- Prueba en Demo: Practica operaciones con configuraciones FVG sin riesgo
- Mantén Registros: Lleva un diario de qué configuraciones funcionan para tu estrategia
Instalación
- Descarga
FairValueGapIndicator.csarchivo - Abre cTrader
- Ve a Automatizar → Indicadores
- Haz clic en "+" para agregar un nuevo indicador
- Selecciona el archivo descargado
- Haz clic en "Compilar"
- Arrastra el indicador al gráfico
Descargo de Responsabilidad
Este indicador es una herramienta para análisis técnico y no garantiza operaciones rentables. Todo trading implica riesgo. El rendimiento pasado de los FVGs identificados no garantiza resultados futuros. Siempre usa una gestión de riesgo adecuada, mantén un tamaño de posición apropiado y nunca arriesgues más de lo que puedes permitirte perder. Esta herramienta debe ser parte de una estrategia de trading integral, no usarse de forma aislada.
Información de la Versión
Versión Actual: 2.0 Última Actualización: Diciembre 2024 Compatibilidad: cTrader 4.x+ Licencia: Gratis para uso personal
Etiquetas
Hueco de Valor Justo, FVG, Dinero Inteligente, ICT, Flujo de Órdenes, Soporte Resistencia, Acción del Precio, Liquidez, Desequilibrio, Zonas de Trading, Estructura del Mercado, Trading Institucional, Oferta Demanda, Señales de Entrada
Capturas de Pantalla Recomendadas
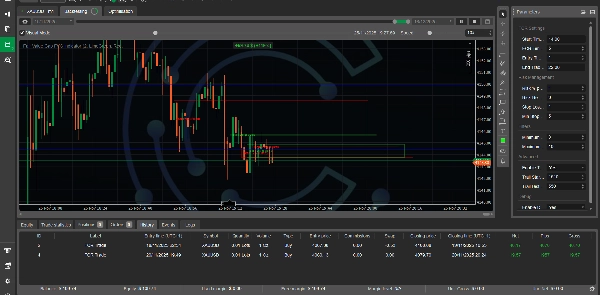
- Vista Principal del Gráfico: Muestra múltiples FVGs con zonas de entrada
- Ejemplo de FVG Alcista: Tendencia alcista clara con soporte FVG
- Ejemplo de FVG Bajista: Tendencia bajista con resistencia FVG
- Detección de Llenado: Muestra antes y después de FVG llenado
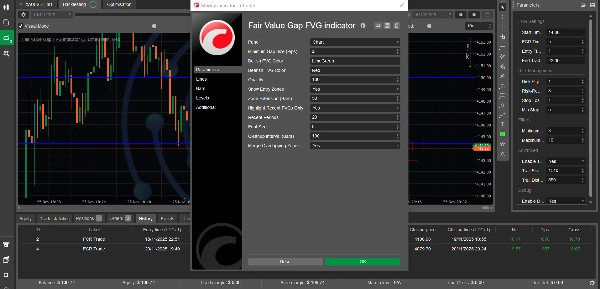
- Panel de Parámetros: Muestra opciones de personalización
- Multitemporal: Mismo instrumento en diferentes marcos temporales
Registro de Cambios
Versión 2.0 (Diciembre 2024)
- ✅ Corregido algoritmo crítico de detección de FVG
- ✅ Implementadas optimizaciones de rendimiento (10-20x más rápido)
- ✅ Añadido sistema de dibujo incremental (95% menos redibujos)
- ✅ Mejorado manejo de errores y estabilidad
- ✅ Añadida opción para combinar zonas superpuestas
- ✅ Mejorado registro y depuración
- ✅ Optimizada gestión de memoria
- ✅ Añadida validación completa
Versión 1.0 (Lanzamiento Inicial)
- Detección básica de FVG
- Zonas codificadas por color
- Resaltado de zona de entrada
- Seguimiento de llenado
Resumen
Designed for use on all timeframes and instruments—including Forex, indices, commodities, cryptocurrencies, and stocks—it supports multi-timeframe analysis and offers extensive customization of display options such as gap size filters, zone extension, colors, opacity, and label fonts. Performance optimizations ensure efficient operation with minimal redraws and memory use.
Traders can apply the indicator for support/resistance trading, trend continuation entries, liquidity grabs, and risk management by using FVG boundaries for stop loss and take profit placement. The tool is compatible with cTrader 4.x and above and functions as a standalone indicator without external dependencies. It does not repaint and maintains a historical record of gaps for analysis.
Valoraciones de clientes
5 | 50 % | |
4 | 50 % | |
3 | 0 % | |
2 | 0 % | |
1 | 0 % |


![Logotipo de "[Stellar Strategies] MARSI Signal Plotter"](https://cdn.ctrader.com/image/webp/7b2b8da6-8f8e-4646-8d4a-4710c516c01e_25567)