Opis
The AdaptiveTrendChannel to wskaźnik, który pomaga lepiej i dynamiczniej wizualizować trendy rynkowe. 📈 W przeciwieństwie do zwykłej średniej kroczącej, dostosowuje się w czasie rzeczywistym wraz z rozwojem ceny, pozwalając zobaczyć kiedy trend się zmienia. 🔄
🛠️ Jak to działa?
Pierwszą rzeczą, którą robi, jest generowanie dynamicznej linii odniesienia, która aktualizuje się z każdą świecą. 🕯️ Traktuj tę linię jako punkt równowagi, informujący, czy cena znajduje się w strefie równowagi, czy porusza się w wyraźnym kierunku.
Ale ta linia nie działa sama! Opiera się również na wewnętrznych poziomach, które pełnią rolę dynamicznych wsparć i oporów. 💪 Te poziomy są stale dostosowywane na podstawie ostatnich maksimów i minimów 📉📈, co oznacza, że nie są stałe — dostosowują się do warunków rynkowych w czasie rzeczywistym.
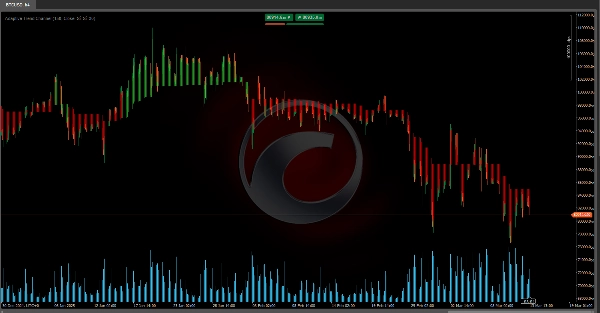
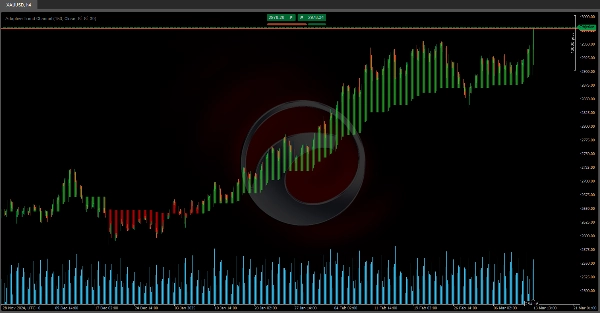
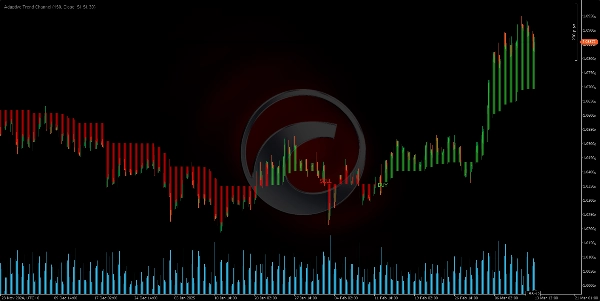
Gdy cena przekracza powyżej lub poniżej tych dynamicznych poziomów, wskaźnik wykrywa zmianę trendu i generuje sygnały. Aby było to jeszcze bardziej czytelne, koloruje obszar pomiędzy linią odniesienia a ceną zamknięcia, czyniąc trendy wizualnie oczywistymi. 🎨👀
📌 Jak używać tego w handlu?
Jak zastosować to w rzeczywistych transakcjach? Prosto.
✅ Jeśli cena utrzymuje się powyżej linii odniesienia przez kilka świec, rynek uznaje się za byczy. 🟢
❌ Jeśli cena spada poniżej linii odniesienia, rynek uznaje się za niedźwiedzi. 🔴
Ponieważ ta linia dynamicznie się dostosowuje i filtruje szumy rynkowe, daje Ci czystszy obraz trendu.
Dodatkowo wskaźnik śledzi ostatnie przecięcia:
🔻 Jeśli cena przecina się poniżej kluczowego poziomu wewnętrznego, sygnalizuje to potencjalną fazę niedźwiedzią.
🔺 Jeśli cena przecina się powyżej kluczowego poziomu wewnętrznego, sygnalizuje to potencjalną fazę byczą.
Dzięki tym informacjom wskaźnik robi dwie kluczowe rzeczy:
🎨 Zmienia kolor linii i obszaru wykresu, dając Ci natychmiastową wskazówkę wizualną o kierunku trendu.
📢 Generuje sygnały kupna/sprzedaży, gdy wykrywana jest zmiana trendu.
🔥 Dlaczego jest tak potężny?
The AdaptiveTrendChannel pomaga Ci pozostać po właściwej stronie trendu i unikać handlu przeciwko momentum rynku. Podkreśla kluczowe momenty dla punktów wejścia i wyjścia, dając Ci jasny wizualny punkt odniesienia dla mądrzejszych decyzji handlowych.
W połączeniu z innymi narzędziami, takimi jak analiza wolumenu lub akcja cenowa, staje się potężnym sprzymierzeńcem do filtrowania transakcji i poprawy precyzji wejścia. 🚀💰
Wskaźniki ze sklepu Ctrader:
Dynamic Market Structure
Analysis of Turning Points
Fibonacci Linear
Regression Multi-timeframe
Multi-Level Candle Bias
Tracker
Auto Support and
Resistance Trend Lines
All Support and
Resistance Levels
Podsumowanie
When the price moves above or below these adaptive levels, the indicator detects trend changes and produces buy or sell signals. It visually highlights trends by coloring the area between the reference line and the closing price, providing clear visual cues on trend direction. Traders can interpret price staying above the reference line as bullish and below it as bearish, with the indicator filtering out market noise for a cleaner trend view.
Additionally, the Adaptive Trend Channel tracks recent crossovers of key internal levels to signal potential bullish or bearish phases. It is intended to help traders stay aligned with market momentum and identify key entry and exit points. When combined with other tools like volume analysis or price action, it supports improved trade filtering and entry precision.
Opinie klientów
5 | 100 % | |
4 | 0 % | |
3 | 0 % | |
2 | 0 % | |
1 | 0 % |