
Repiptor BB Colored Width
Wskaźnik
156 pobrania
Wersja 1.0, Oct 2024
Windows, Mac
5.0
Opinie: 1
Opis
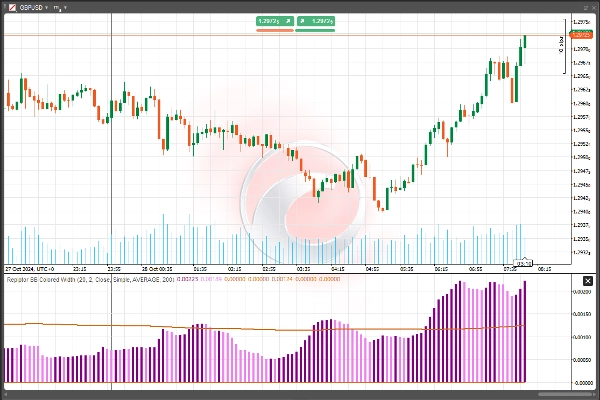
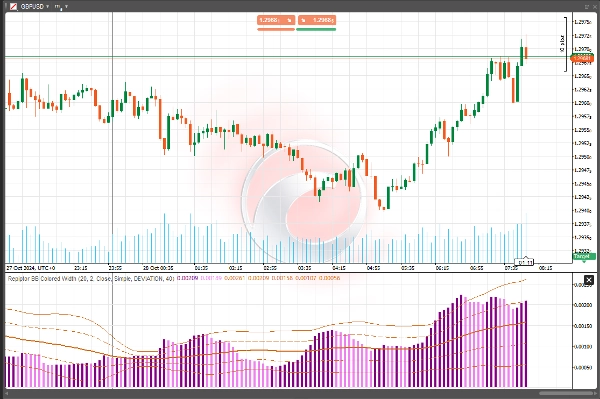
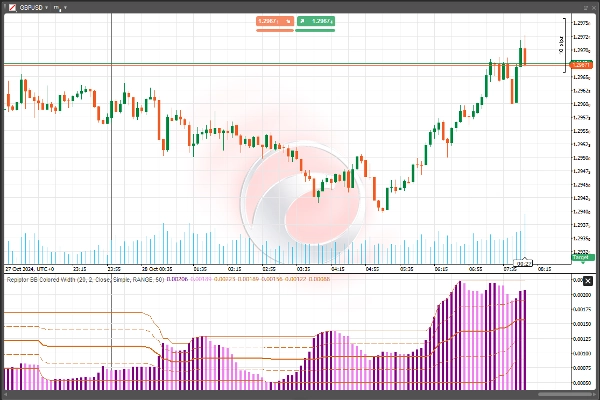
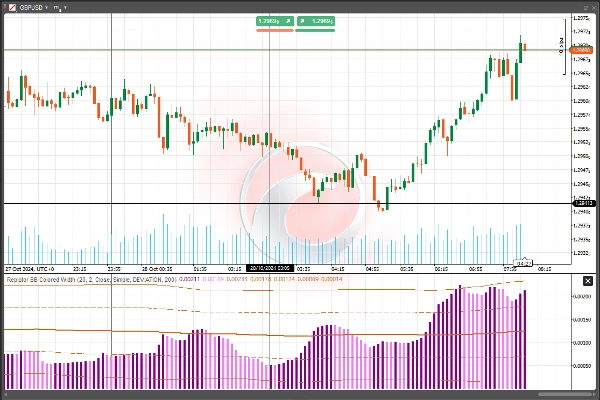
Kolorowa szerokość wstęg Bollingera z czterema alternatywnymi poziomami dynamicznymi:
- Średnia
- Mediana
- Odchylenie
- Zakres
Ciemniejszy kolor = wzrost zmienności, jaśniejszy kolor = spadek zmienności
Podsumowanie
Podsumowanie AI
Repiptor BB Colored Width is a technical indicator that visualizes the width of Bollinger Bands with color coding to represent volatility changes. It offers four dynamic measurement levels for the Bollinger Bands width: Average, Median, Deviation, and Range. The indicator uses color intensity to indicate volatility trends—darker colors signify increasing volatility, while lighter colors indicate decreasing volatility. This tool helps traders assess market volatility visually by highlighting changes in the Bollinger Bands width on their charts.
Profil wskaźnika
Opinie klientów
5.0
Opinie: 1
5 | 100 % | |
4 | 0 % | |
3 | 0 % | |
2 | 0 % | |
1 | 0 % |
Opinie klientów
August 18, 2025
Clear volatility visualization, customizable, lightweight. Cons: No alerts, no MTF mode, lacks integrated breakout signals.
Dyskusja
Częste pytania
Bollinger
Produkty dostępne za pośrednictwem cTrader Store, w tym boty handlowe, wskaźniki i wtyczki, dostarczane są przez deweloperów zewnętrznych i udostępniane wyłącznie w celach informacyjnych oraz w celu zapewnienia dostępu technicznego. cTrader Store nie jest brokerem i nie zapewnia doradztwa inwestycyjnego, nie udziela spersonalizowanych rekomendacji ani nie gwarantuje przyszłych wyników.
Więcej od tego autora


Cena
Od 26/10/2024
1.18K
Bezpłatne instalacje