
Breakout channel
Wskaźnik
527 pobrania
Wersja 1.0, Nov 2025
Windows, Mac
Opis
Kanały wybicia
Co robi
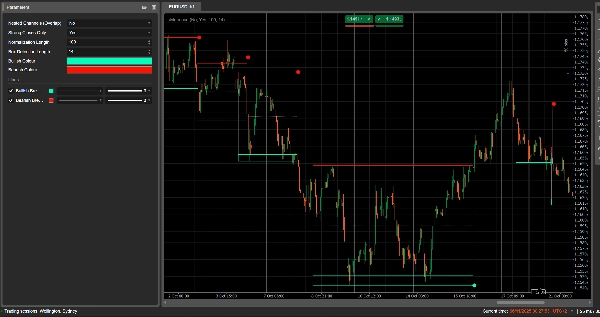
Kanały wybicia automatycznie wykrywają zakresy konsolidacji („pudełka” cenowe) i oznaczają punkty wybicia, gdy cena opuszcza te zakresy.
Rysuje:
- Szare pudełko kanału wokół strefy konsolidacji
- Czerwony górny pas (potencjalny opór)
- Zielony dolny pas (potencjalne wsparcie)
- Białą kropkowaną linię środkową (środek kanału)
- Kolorowe kropki, gdy następuje wybicie:
-
- Zielona/cyjanowa kropka poniżej pudełka → wzrostowe wybicie
- Czerwona kropka powyżej pudełka → spadkowe wybicie
Idea polega na wizualnym wyróżnieniu obszarów, gdzie cena się zwija i gdzie prawdopodobnie rozpoczną się silne ruchy po przebiciu zakresu.
Jak to oblicza
- Normalizacja ceny
-
- Na podstawie ostatnich Długość normalizacji świec znajduje najwyższy szczyt i najniższy dołek.
- Normalizuje zamknięcie do zakresu 0–1:
normalizedPrice=Close−LowestLowHighestHigh−LowestLow\text{normalizedPrice} = \frac{\text{Close} - \text{LowestLow}}{\text{HighestHigh} - \text{LowestLow}}normalizedPrice=HighestHigh−LowestLowClose−LowestLow
- Miara zmienności
-
- Oblicza odchylenie standardowe znormalizowanej ceny na przestrzeni 14 świec.
- Daje to serię zmienności używaną do wykrywania punktów zwrotnych w strukturze rynku.
- Górne / dolne „linie zmienności”
-
- Na podstawie ostatnich (Długość wykrywania pudełka + 1) świec znajduje:
-
- świecę, gdzie zmienność była najwyższa
- świecę, gdzie zmienność była najniższa
- Na podstawie tego, ile świec temu wystąpiły te ekstrema, buduje dwie syntetyczne linie: Górną i Dolną.
- Przecięcia między tymi liniami sygnalizują potencjalny początek/koniec fazy kanału.
- Początek i czas trwania kanału
-
- Gdy Dolna linia przecina Górną od dołu, wskaźnik oznacza potencjalny początek kanału.
- Od tej świecy śledzi czas trwania oraz najwyższy szczyt / najniższy dołek w tym okresie.
- Tworzenie kanału
-
- Gdy później Górna linia przecina Dolną od dołu, a czas trwania jest większy niż 10 świec:
-
- Definiuje górną granicę kanału jako najwyższy szczyt w tym okresie.
- Definiuje dolną granicę kanału jako najniższy dołek.
- Mierzy aktualny ATR/2, aby oddzielić cienką strefę u góry i u dołu:
-
- Czerwony pas u góry (pas spadkowy)
- Zielony pas u dołu (pas wzrostowy)
- Rysuje:
-
- Szary prostokąt obrysu (pełny kanał)
- Czerwony górny obrys
- Zielony dolny obrys
- Białą kropkowaną linię środkową przez środek
- Kanały pozostają na wykresie jako struktura historyczna (nie są usuwane po wybiciu).
- Wykrywanie wybicia
-
- Dla każdego aktywnego kanału, przy każdej nowej świecy oblicza cenę referencyjną:
-
- Jeśli Tylko mocne zamknięcia = true → używa środka korpusu świecy:
refPrice=(Open+Close)/2\text{refPrice} = (\text{Open} + \text{Close})/2refPrice=(Open+Close)/2
Wymaga to, aby ponad połowa korpusu znajdowała się poza pudełkiem. - Jeśli Tylko mocne zamknięcia = false → używa prostego zamknięcia.
- Jeśli Tylko mocne zamknięcia = true → używa środka korpusu świecy:
- Zasady wybicia:
-
- Jeśli
refPrice > Top→ wzrostowe wybicie -
- Rysuje zieloną kropkę na dole kanału.
- Dezaktywuje ten kanał (przestaje go rozszerzać), ale pudełko pozostaje widoczne.
- Jeśli
refPrice < Bottom→ spadkowe wybicie -
- Rysuje czerwoną kropkę na górze kanału.
- Dezaktywuje kanał.
- W przeciwnym razie kanał pozostaje aktywny, a jego prawy brzeg jest rozszerzany do bieżącej świecy.
- Jeśli
- Opcja kanałów zagnieżdżonych
-
- Jeśli Kanały zagnieżdżone = true, wiele kanałów może nakładać się w czasie i cenie.
- Jeśli false, wskaźnik blokuje tworzenie nowego kanału, który nakładałby się na istniejący.
Jak czytać i używać
- Szare pudełko (kanał)
-
- Reprezentuje strefę konsolidacji / równowagi, w której cena handlowała przez pewien czas.
- Im dłuższe i wyższe pudełko, tym bardziej znaczący zakres.
- Czerwony górny pas (strefa oporu)
-
- Górna część kanału, wizualnie podkreślona jako potencjalny obszar oporu.
- Powtarzające się odrzucenia przy tym pasie sugerują presję sprzedaży w zakresie.
- Zielony dolny pas (strefa wsparcia)
-
- Dolna część kanału, wyróżniona jako potencjalne wsparcie.
- Powtarzające się odbicia sugerują obronę dolnej granicy zakresu przez kupujących.
- Biała kropkowana linia środkowa
-
- To środek kanału – rodzaj lokalnej „uczciwej wartości”.
- Oscylowanie ceny wokół tej linii wskazuje na równowagę; silne ruchy od niej często poprzedzają test przeciwległego pasa.
- Kropki wybicia
-
- Zielona kropka poniżej pudełka:
-
- Cena zamknęła się mocno powyżej górnej granicy kanału (lub po prostu powyżej, w zależności od Tylko mocne zamknięcia).
- Sugeruje wzrostowe wybicie – potencjalny początek ruchu w górę po ścisku zmienności.
- Czerwona kropka powyżej pudełka:
-
- Cena zamknęła się mocno poniżej dolnej granicy kanału.
- Sugeruje spadkowe wybicie – potencjalny początek ruchu w dół.
- Typowe sposoby użycia (na poziomie pomysłu)
-
- Wybicia podążające za trendem
-
- Handluj w kierunku wybicia (kupuj po zielonej kropce, sprzedawaj po czerwonej), najlepiej w zgodzie z trendem na wyższym interwale lub innymi wskaźnikami.
- Filtr i potwierdzenie
-
- Używaj kanału i jego wybicia tylko jako filtru dla swojej istniejącej strategii (np. bierz tylko długie pozycje, jeśli ostatni sygnał to wzrostowe wybicie).
- Umiejscowienie ryzyka
-
- Dla wzrostowych wybicia wielu traderów umieszcza stop lossy wewnątrz lub tuż poniżej poprzedniego kanału; dla spadkowych, wewnątrz lub powyżej pudełka.
Podsumowanie
Podsumowanie AI
Breakout Channels is a technical indicator designed to identify consolidation zones and signal potential price breakouts. It automatically detects price ranges where the market is coiling, marking these with a grey channel box that highlights the consolidation area. The indicator draws a red upper band indicating potential resistance, a green lower band indicating potential support, and a white dotted midline representing the channel midpoint or local fair value.
Breakout points are signaled by colored dots: a green or cyan dot below the box indicates a bullish breakout, while a red dot above signals a bearish breakout. The indicator calculates these zones by normalizing price data, measuring volatility through the standard deviation of normalized prices, and identifying volatility extremes to define channel start and duration.
Channels remain visible on the chart as historical structures even after breakouts. Users can enable nested channels to allow overlapping consolidation zones. Breakout detection uses either candle body midpoints or close prices, depending on settings, to confirm strong closes outside the channel.
Typical uses include trading in the breakout direction, filtering existing strategies, and placing risk stops near channel boundaries. The indicator supports various markets including forex, indices, commodities, stocks, and cryptocurrencies.
Profil wskaźnika
Opinie klientów
0.0
Opinie: 0
Opinie klientów
Ten produkt nie ma jeszcze opinii. Wypróbowałeś(-aś) go już? Bądź pierwszy(-a) i powiedz o tym innym!
Dyskusja
Częste pytania
Signal
Indices
Commodities
GBPUSD
RSI
Bollinger
Fibonacci
Scalping
AI
XAUUSD
NAS100
MACD
BTCUSD
Forex
Breakout
EURUSD
NZDUSD
Martingale
Prop
ZigZag
Supertrend
Fair Value Gap
SMC
Crypto
Grid
Stocks
ATR
USDJPY
VWAP
Produkty dostępne za pośrednictwem cTrader Store, w tym boty handlowe, wskaźniki i wtyczki, dostarczane są przez deweloperów zewnętrznych i udostępniane wyłącznie w celach informacyjnych oraz w celu zapewnienia dostępu technicznego. cTrader Store nie jest brokerem i nie zapewnia doradztwa inwestycyjnego, nie udziela spersonalizowanych rekomendacji ani nie gwarantuje przyszłych wyników.


Cena
42.11M
Wolumen transakcji
6.13M
Zysk w pipsach
231
Sprzedaż
8.56K
Bezpłatne instalacje